Introduction
With global infection rates showing no signs of abating, the coronavirus pandemic continues to pose significant uncertainties for the economic and corporate outlook. The near-term impact of the coronavirus has been severe for many companies as large swathes of the economy have been impacted by lockdown and restrictions, with disruptions to both demand (e.g. customers being unable or unwilling to buy goods and services in sectors such as retail, hospitality and travel) and supply (e.g. supply-chain constraints and factory closures). This disruption has retarded corporate profitability and cash generation, in some cases resulting in cash burn. This is likely to continue. We believe there could also be significant, if less widespread, longer-term impacts from the pandemic, including the economic impact of all furloughed employees not returning to the workforce. Indeed, current projections are for Western Europe GDP to only recover 2019 levels beyond 2022.
Furthermore, the virus could cause or catalyse secular transitions, including:
- A step-change in the proportion of office employees regularly working from home could reduce the demand for urban office space, with negative implications for office construction, ownership and servicing and the infrastructure (transport, retail) that supports office work, while boosting demand for out-of-office connectivity and IT services;
- A reduction in corporate travel (driven by sustainability and cost benefits), as the efficacy of virtual interaction with colleagues or clients in other locations has been demonstrated through the crisis. This is likely to have negative implications for business demand for flights, car hire and hotels;
- Many consumers have embraced online retail across a broader scope of consumption out of necessity through the crisis, some of whom who will not return to their pre-crisis shopping habits, with increased volumes boosting efficiencies and unit economics of online retailers relative to their bricks-and-mortar peers.
In this article, we consider how the pandemic and its aftermath might impact the credit risk profile of borrowers in the European leveraged finance market and the implications that it can have for pricing of European leveraged debt. Using bottom-up projections through 2021 for a broad section of more than 200 borrowers in the European leveraged finance universe, we forecast how we see earnings, cash generation and leverage evolving overall and by sector (aggregated into 16 industries). A word of caution here: the sample size for some sectors is limited, notably auto-parts with five credits, which means idiosyncratic features dominate some of the output.
Earnings
We project an earnings before interest, taxes, depreciation, and amortization (‘EBITDA’) decline of 11% on average in financial year 2020 (‘FY20’) versus FY19 and then a near-complete recovery in FY21, when EBITDA is expected to rebound to just 2% behind FY19 levels. This looks broadly consistent with sell-side equity analysts, who are projecting a 16% decline in 2020 EBITDA for the Euro Stoxx 600, with 2021 estimates still 3% behind 2019 levels. However, while it can be reassuring that we see EBITDA in FY21 almost back to FY19 levels on average, there is an interesting amount of dispersion within that, with 16% of the covered universe seeing FY21 EBITDA 15% below FY19 levels or worse (Figure 1).
Figure 1. FY21e EBITDA Dispersion
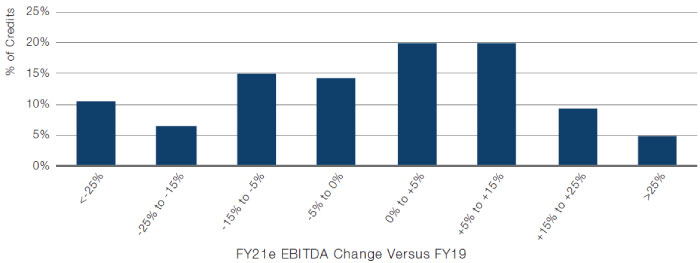
Source: Man GLG; as of 12 October 2020. Illustrative example – for information only.
We expect the weakest performance in both FY20 and FY21 to come from four sectors:
- Leisure and gaming: We expect EBITDA to fall by 57% in FY20 as lockdown restricted access to gaming halls, cruise ship sailing was suspended for much of the year, and compressed travel volumes hit visa applications and vacation parks. FY21 EBITDA is expected to be 24% below FY19 levels as we expect travel volumes remain soft in the early part of 2021;
- Auto-parts: We expect EBITDA to fall by 39% in FY20, with original equipment manufacturer (‘OEM’) factory closures during lockdown exacerbating pre-existing demand softness and weak consumer sentiment weighing on the recovery in FY21. As such, we expect FY21 EBITDA will still be 13% below FY19 levels;
- Retail: We expect EBITDA to fall by 19% in FY20 as lockdown restrictions on shopping catalyse market-share gains by online retail. As such, we expect FY21 EBITDA to still be 10% behind FY19 levels; and
- Commercial services: We expect EBITDA to fall by 21% in FY20 with lockdown and travel restrictions limiting interaction with their customers. We also expect FY21 EBITDA to be 9% behind FY19 levels as tight cost management will drag on demand recovery from their clients.
Figure 2. Projected EBITDA Change Versus FY19 by Sector
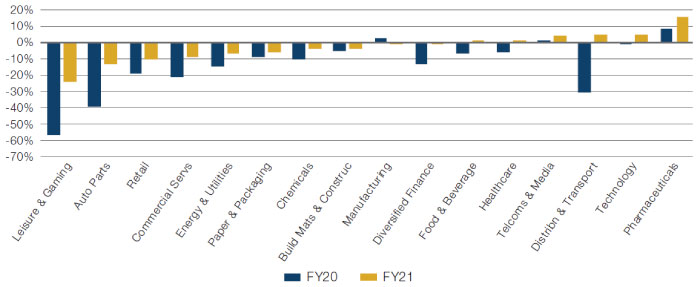
Source: Man GLG; as of 12 October 2020. Illustrative example – for information only.
At the opposite end of the spectrum, it is unsurprising that we see earnings from the food, telecommunications, technology and pharmaceuticals sectors holding up well in FY21 when compared with FY19 levels. We also expect the distribution and transport sector (including some specific tailwinds around online distribution and capacity expansion) to outperform.
Cash Generation
On average, free cash flow (‘FCF’) generation was equal to 4.0% of net debt in FY19, with 27% of the covered universe generating negative FCF. This was mostly due to elevated levels of growth investment (for instance, from debt purchasers, equipment-hire businesses and ship operators) rather than structural cash generation weakness. Indeed, nearly half of the companies with negative FCF in FY19 are projected to generate positive FCF in FY20 despite headwinds from the coronavirus pandemic.
For FY20, we project weaker average FCF generation, equivalent to 2.5% of net debt, with 29% of companies generating negative FCF. This is a moderate deterioration versus FY19 in the context of the crisis and anticipated EBITDA weakness. It reflects proactive cash management by many companies (e.g. deferring capex, suspending travel, freezing salaries), as well as accessing government support programmes (e.g. labour cost support, tax deferrals), although some of that will unwind later in 2020 or in 2021. Where companies do experience negative FCF in FY20, this will more often be involuntary (that is, from structural cash burn) rather than the voluntary (discretionary growth investment) causes that contributed in FY19. In FY21, we forecast average FCF generation to improve to 4.7% of net debt and the portion of the universe generating negative FCF falling to 23%, reflecting EBITDA recovery and continued caution on investments (and despite the catch-up of deferred costs).
Figure 3. Average FCF Generation and Proportion With Negative FCF
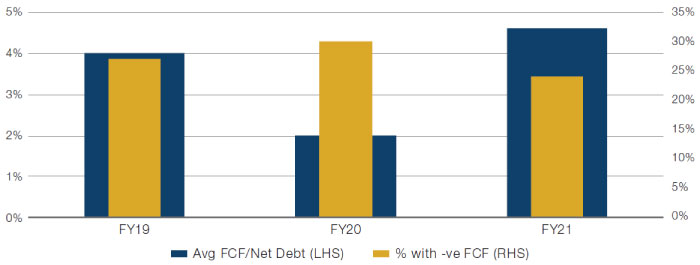
Source: Man GLG; as of 12 October 2020. Illustrative example – for information only.
Overall, as with our EBITDA projections, our forecasts for FCF look reassuring. However, when we drill down, we see some risk elevation. Of the companies forecast to generate negative FCF in FY20, that cash burn is projected to be 8% of net debt, compared with 5% in FY19. In other words, although only slightly more companies will burn cash in FY20 than in FY19, the quantum of that cash burn will also be somewhat higher on average. That has implications for both liquidity (though these companies have generally been proactive in shoring up liquidity through public and private capital) and leverage. To frame the impact of this average negative FCF: if we consider a hypothetical company with 5x leverage and liquidity equal to annual EBITDA, a FCF burn of 8% would increase leverage by +0.4x and consume 40% of available liquidity. This increase in risk would not be immaterial, nor would it be insurmountable especially if the company saw some recovery in FY21.
Weak FCF in FY20 roughly correlates with earnings as one would expect, with leisure and gaming seeing 67% of constituents burn cash, auto-parts 60%, retail 50% and commercial services 37%. However, cash generation for each of these sectors will improve in FY21, with 26% of their constituents on average returning from negative to positive FCF generation. Of the 45 companies projected to generate negative FCF in FY21, the average cash burn is forecast to moderate to 5.0% of net debt.
Figure 4. Percentage of Portfolio Universe With Negative FCF by Sector
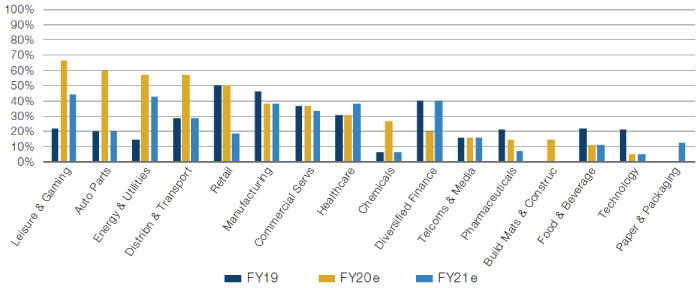
Source: Man GLG; as of 12 October 2020. Illustrative example – for information only.
Leverage
The outlook for leverage – an important metric of debt sustainability – across our covered universe is a function of how we see EBITDA evolution and cash flow. Average leverage for the covered universe for FY19 was 4.7x, which we project to increase to 5.6x by FYE20, before reversing back to 4.7x by FYE21. Thus, once again, the picture is one of overall stability, but with increased risk dispersion as we forecast 45% of the universe can have FYE21 leverage higher than FYE19. For this cohort, average leverage is projected to increase from 4.4x at FYE19 to 6.5x at FYE20 before reversing around half of that increase by FYE21 to 5.4x. Indeed, we see 14% of credits where leverage at FYE21 can be more than 1x higher than at FYE19, and 8% where leverage can be more than 2x higher.
Figure 5. Leverage Evolution
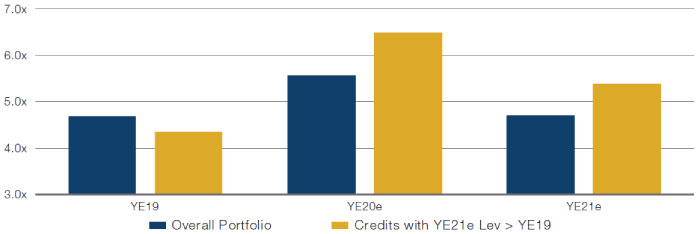
Source: Man GLG; as of 12 October 2020. Illustrative example – for information only.
Unsurprisingly, the sectors where we envisage pressure on earnings and cash flow are expected to see leverage inflation:
- Retail: We expect leverage to increase by +0.9x between FYE19 and FYE21 to 6.0x, with travel-retail (goods bought either for holidays e.g. sunglasses and ski jackets, or at airports e.g. watches) most affected;
- Leisure and gaming: We expect leverage to increase by +0.5x, from a low FYE19 starting point of 3.9x to 4.4x by FYE21, with cruises notably still affected by the pandemic into next year;
- Auto-parts: We expect leverage to increase by +0.4x to 3.7x between FY19 and FY21, though we note more prudent capital structures in this sector than we saw coming into the GFC; and
- Commercial services: We expect leverage to increase by +0.7x to 5.4x between FY19 and FY21.
Figure 6. Leverage Evolution by Sector
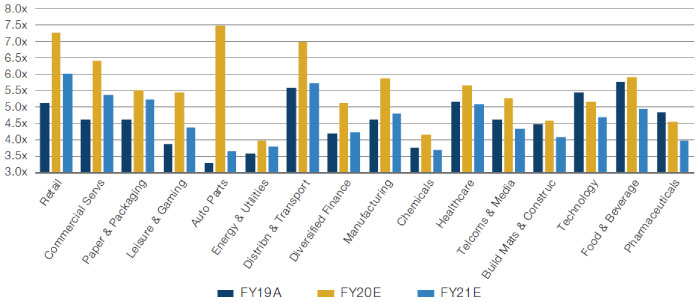
Source: Man GLG; as of 12 October 2020. Illustrative example – for information only.
Implications for Credit Risk
In assessing the implications of the pandemic on credit risk for the European leveraged finance market, we think about the default probability of each borrower, particularly those in the ‘left tail’, from a bottom-up perspective, rather than the average movement in credit metrics from a top-down view. The default risk of a company can be thought of through the following components:
- How much asset or enterprise value is there backing the debt (the loan-to-value or ‘LTV’)?;
- Do we expect that asset or enterprise value to increase or decrease in future, including through expected changes in earnings, cash generation and valuation multiples?;
- How uncertain is that expectation, particularly with reference to the (probability and severity of the) downside given competitive, cyclical and secular risks?;
- Is there sufficient liquidity to continue servicing its obligations in a reasonable downside?
In other words, we think about how much cushion there is below the rank of debt owned and the potential for that cushion to be eroded. Thus, rising leverage ceteris paribus implies increased default probability as it reduces cushion. Meanwhile, rising uncertainty also increases the risk of defaults, as the tails of good and bad outcomes become more probable, thereby increasing the potential cohort of deteriorating credits from which defaults will be populated. To the extent that uncertainty is more weighted to the downside, the cohort of deteriorating credits increases further.
Figure 7. How Default Probabilities Rise With Uncertainty for a Company Levered at 5x With an EV of 9x
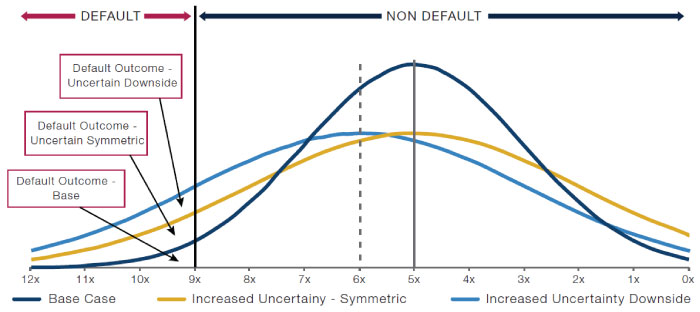
Source: Man GLG. Illustrative example – for information only. Note that the area below the curve and to the left of the default line corresponds illustratively to default probability, with the increases areas under the ‘Uncertain Symmetric’ and again under the ‘Uncertain Downside’ indicating increased default risk.
Given that, on average, we see FYE21 leverage returning to FYE19 levels, one might think that implies a stable outlook for defaults. However, the average masks an increase in expected dispersion, which implies a larger ‘left-tail’ of potential defaults. This dispersion is a function of:
- The pandemic having a deteriorating impact on some credits, with leverage increasing particularly in the retail, commercial services, leisure and gaming and auto-parts sectors, thus reducing cushion; and
- We believe uncertainty has increased as a result of the coronavirus, especially for sectors vulnerable to secular shifts catalysed by the epidemic and credits exposed to longer-term i.e. post-virus economic disruption (including the risk of employment remaining above pre-virus levels and thus weakening consumer sentiment).
It is not straightforward to calibrate the impact of changes in credit metrics on default probabilities and the appropriate spread compensation for the risk – indeed, this is as much art as science. However, it can be useful to reference option-pricing framework as a guide for quantifying how fluctuations in credit metrics alter the risk profile of a credit. Figure 8 illustrates how the fair credit spread (that is, the compensation appropriate to the default risk) of a 5-year loan or bond increases with leverage and with uncertainty (analogous to volatility) on such a pricing framework.
Figure 8. CLO Fair Value Spread
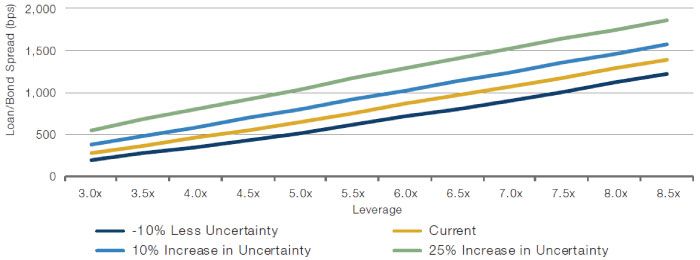
Source: Man GLG. Illustrative example – for information only.
This framework suggests that a 1x rise in leverage requires around a +200 basis points increase in credit spread implied by the bond or loan price to reflect the elevation in risk. So, for the four sectors highlighted where FYE21 leverage is expected to be 0.4x to 0.9x above FY19, we could expect an increase in credit spread of 100bp to 200bp to compensate for this risk on average (with some individual credits needing to increase by more). For reference, using the Bloomberg CDSW function, a +100bp increase in credit spread corresponds to a +5.5% increase in cumulative 5-year default probability, or +1.1% annualised default probability.
Uncertainty is inherently a difficult concept to measure. However, to illustrate the concept, an increase of the volatility input into the pricing model by a factor of 10% (from 50% to 55%) requires an increase in credit spread of +150bp (though we acknowledge that quantifying uncertainty in this way is somewhat artificial). It seems intuitive that the four sectors where we see the greatest leverage increase are also sectors where the uncertainty is above average and thus should see some uncertainty spread premium in addition to spread premium for the increased leverage.
Against this background of uncertainty and dispersion increasing in the European leveraged finance market, the year-to-date increase in the JPM European Leverage Loan index of +113bp and in the JPMorgan European High Yield Bond index of +143bp seems broadly reasonable.
Figure 9. JPMorgan Euro Leveraged Loan and High Yield Bond Spreads
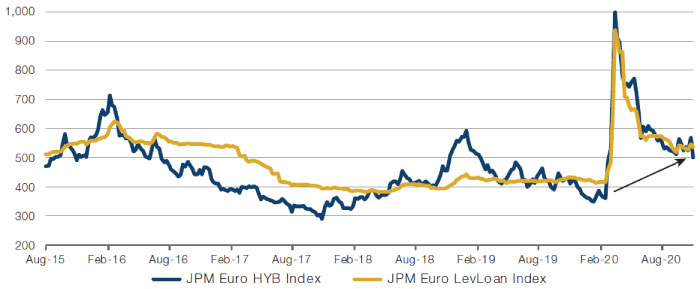
Source: Bloomberg; as of 6 November 2020. Illustrative example – for information only.
At the sector level, it seems consistent with our projections that the consumer products (aligning roughly within our retail sector definition) and gaming sectors have seen the worst year-to-date performance (in both loans and HYBs). However, the negative outlook in our leisure and gaming forecasts in FY21 is more a function of leisure (e.g. cruise ships) than gaming, suggesting potential value in gaming credits. The services HYB index is also a modest underperformer, having widened by +210bp year-to-date which seems consistent with our expectations, though the services loan index has held up rather better (+98bp wider year-to-date). The auto sector has performed in line with the market with the auto loan index being 19th and the auto HYB index 24th out of 40 measured on percentage-spread move, which given our forecast increase in leverage and elevated uncertainties may insufficiently reflect the higher risks. The outperformance of the food, cable and health-care loan indices is also consistent with our expectations. It is perhaps more surprising to see the chemical loan index as the 8th best performer year-to-date given consumer-demand risks, but we see the sector with leverage stable through FY21 and below average (at 3.7x) which supports credit spread performance.
Figure 10. JPMorgan Euro Leveraged Loan and High Yield Bond Spread and Year-to-Date Change
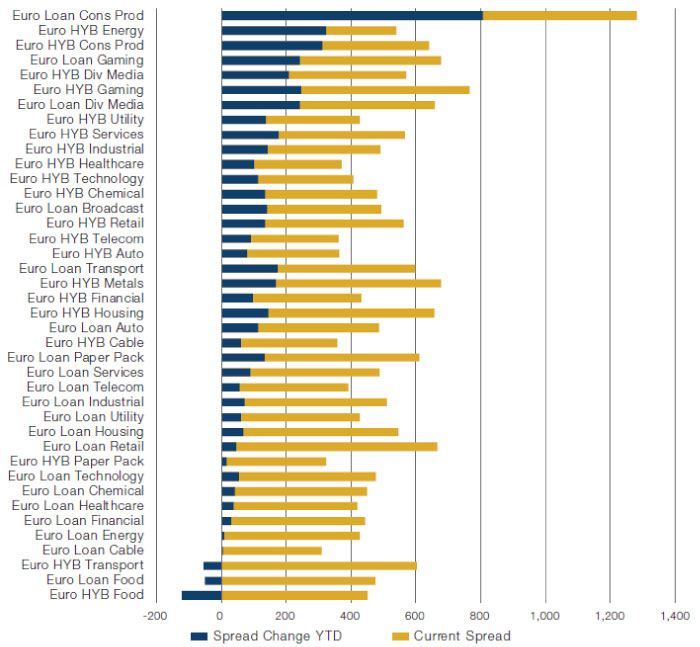
Source: Bloomberg; as of 6 November 2020. Illustrative example – for information only.
Outlook
The trend of infections as we come into winter and impact of second-wave lockdowns will continue to be prime data points to influence our projections. In addition, we will closely track unemployment data, GDP outrun and other economic indicators, together with the shape and longevity of government or central bank support, and how this varies by sector and country at a macro level. At the micro level, our focus through company results in the coming quarters will be on signposts in company results and management commentaries with regards to, inter alia:
- Timing of repayments of government loans or tax deferrals;
- How quickly companies are absorbing returning employees and whether this will outpace the demand recovery;
- The extent to which snap-back of pent-up demand in the short-term overstates the longer-term underlying demand trend;
- Supply chain disruptions that could impact productivity and input costs as demand recovers, including where supply chain tightness might not be immediately evident as companies run down their own inventory;
- Risks around working capital including receivable delays, inventory build-up or supplier constraints;
- Consumer willingness to embrace social-proximity activities in sectors such as retail, hospitality, and entertainment;
- Additional costs or constraints on productivity incurred to remain compliant with government guidance, such as social distance requirements on construction sites and distribution centres, causing profitability to lag a sales recovery.
Conclusion
While cognisant of the risks inherent in talking about financial projections when the uncertainty over the near- and longer-term implications of the coronavirus remain elevated, we believe that:
- The impact of coronavirus will be material in the near term. As such, we expect an 11% decline in EBITDA and a +0.9x increase in leverage on average across the universe in FY20;
- However, this is expected to reverse in FY21, taking EBITDA and leverage on average back to FY19 levels as companies have proactively used many of the liquidity and cost levers available to them;
- Dispersion of financial performance and credit risk metrics will increase, with auto parts, commercial services, leisure and gaming and retail sectors all projected to see FY21 EBITDA meaningfully below FY19 levels and leverage 0.4-0.9x higher over the same period;
- Furthermore, increased uncertainty elevates the downside risk, especially where the coronavirus could accelerate secular transition or lead to long-term economic disruption.
In the face of this increased dispersion and uncertainty, the year-to-date widening in spreads of +113bp for LevLoans and +143bp for HYBs looks broadly sensible to us. However, as the elevation in credit risk since the start of the coronavirus pandemic weighs more heavily on certain sectors and credits, we believe the market repricing of these risks is less nuanced than it should be, increasing opportunities for portfolio rotation supported by deep-dive fundamental asset selection.
You are now leaving Man Group’s website
You are leaving Man Group’s website and entering a third-party website that is not controlled, maintained, or monitored by Man Group. Man Group is not responsible for the content or availability of the third-party website. By leaving Man Group’s website, you will be subject to the third-party website’s terms, policies and/or notices, including those related to privacy and security, as applicable.