Introduction
Is the US housing market at risk of another crisis because of coronavirus? Indeed, with US unemployment going from record lows to the comically absurd, and with the economy expected to experience a deep drawdown during the second quarter of this year, it is no surprise that comparisons are being made with the Global Financial Crisis (‘GFC’).
As such, it is worth reflecting on the key drivers of the US residential real estate markets during the years leading up to the peak of the last cycle (i.e. 2003-2006) and compare those to the last 2-3 years to point out similarities and differences.
Spoiler alert – the current state of the market looks quite different to the mid-2000s and many market fundamentals appear to be on firmer footing than back ‘then’. More importantly, there are significant regional differences which, in our opinion, are likely to create a range of opportunities in coming months and years.
Comparing ‘Then’ and ‘Now’ for Five Factors
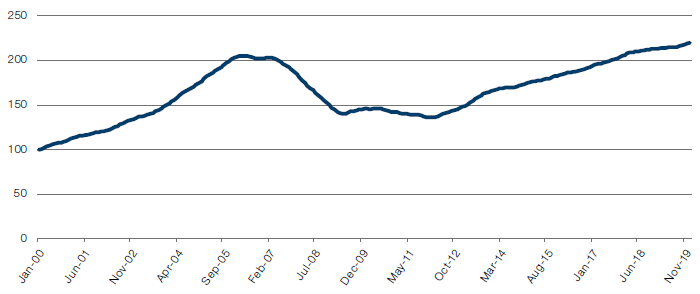
The US housing market, as measured by the Case Schiller 20-City index, peaked in April 2006 before plunging by 34% to hit a bottom in March 2012 (Figure 1). The biggest year-on-year change was registered between January 2008 and January 2009, when house prices declined 18.9%.
Figure 1. Case-Shiller 20-City Index
Source: Case Schiller 20-City Index; as at February 2020.
It’s important to note here that the GFC was the only period – since the Federal Housing Finance Agency (‘FHFA’) started systematically collecting house price data in 1975 – that the entire nationwide housing market has recorded a downcycle. During the many previous recessions, there have been individual states or metro areas that have experienced significant negative home price growth. However, overall, the nationwide market had been relatively insulated from economic recessions – until the GFC, that is. To pick a few illustrative examples of such regional differences: Austin (TX) saw a house price decline of 20% during the 1990-1991 recession, but saw house prices increase 3% during 2008-2009, while in Las Vegas, home prices were up 11% in early ’90s, but plummeted 60% during the GFC.1
We would argue that five fundamental forces shape the housing market: home price growth, supply, demand, household income and household indebtedness. We compare all five factors from ‘then’ (2004 to 2006) to ‘now’ (2017-2020).
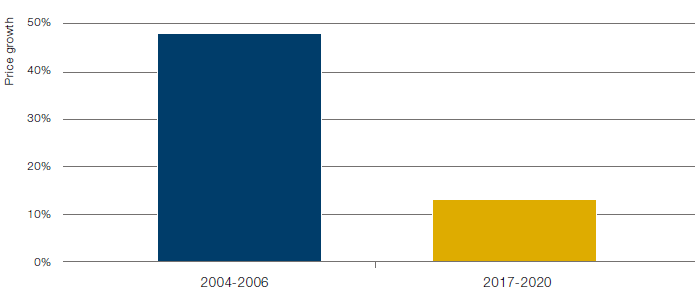
Let’s start with home price growth. House prices in the US rose by cumulative 48% during the three years leading up to the peak of last housing cycle. This contrasts to the last three years to today, when house prices have seen a much more modest cumulative inflation of 13% (Figure 2).
Figure 2. House Price Growth
Source: Case Schiller 20-City Index; as of April 2020. Note: 2004-2006 data as of three years to April 2006; 2017-2020 data as of three years to January 2020.
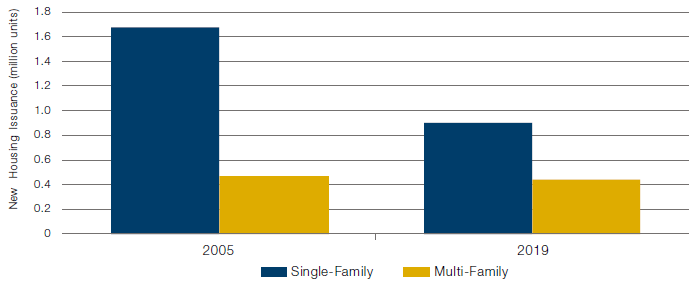
In terms of supply, in 2005 (the last full year before market peak), 1.7 million new construction permits were issued for single-family houses, while 470,000 were issued for multi-family units (Figure 3). In comparison, the supply of new housing stock (construction) was much more muted in 2019, when only 0.9 million single-family permits were issued. However, the multi-family market continued to be particularly active, with 440,000 units (which was close to the 2005 peak levels).
Figure 3. Supply of New Housing Stock
Source: Census Bureau; as of December 2019.
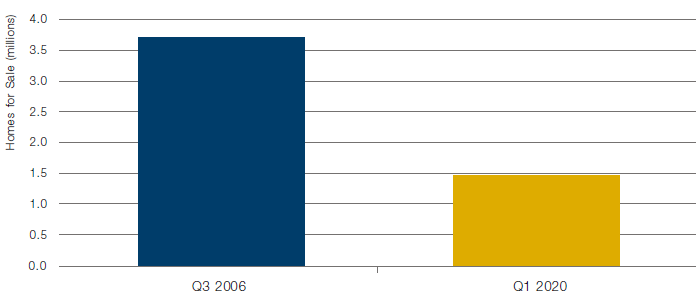
In terms of demand, at the very peak of the housing market in summer of 2006, there were 3.7 million homes on the market for sale. The year also saw record sales as cheap financing and bubble-like mania induced the housing market boom (Figure 4). In contrast, there were only 1.5 million homes for sale in early 2020, creating a relatively tight market between demand and supply.
Figure 4. Homes for Sale
Source: NAR, Morgan Stanley Housing Tracker; as of April 2020.
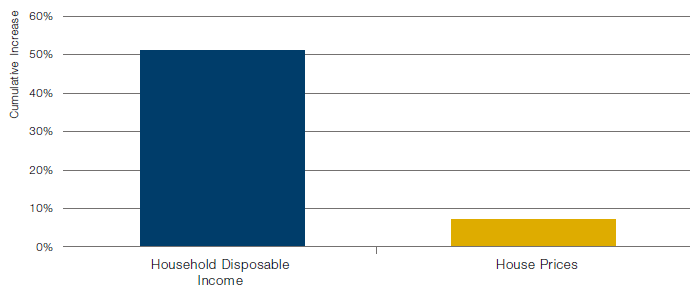
Now let’s focus on the finances of the end consumer, home buyer or renter: since the market peak in mid-2006, nationwide home prices are up approximately 7%, while disposable household income is up 51% (Figure 5).
Figure 5. Disposable Income Versus House Prices
Source: St Louis Fed, Case-Schiller 20-City Index; as of April 2020.
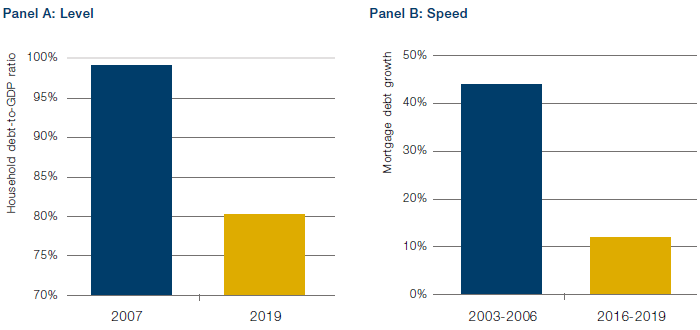
Similarly, household balance sheets appear to be in a better shape ‘now’ compared with ‘then’. More specifically, the household debt-to-GDP ratio stood at 99% prior to the GFC. Following years of deleveraging, the ratio has fallen to 80% (Figure 6, Panel A). More notable is how fast those households added debt on their balance sheets: during the three years leading up to the peak of the housing market in 2006, there was a 44% cumulative growth in mortgage debt outstanding following relaxed mortgage lending standards (including, but not limited to, the sub-prime boom). Over the past three years leading up to the COVID-19 crisis, the market has seen 12% cumulative growth in mortgage debt outstanding (Figure 6, Panel B).
Figure 6. Household Indebtedness – Level Versus Speed
Source: US Census Bureau; as of April 2020.
Conclusion
With the GFC still lingering on investors’ minds, it is no surprise that the US housing market is being looked at for signs of overheating. However, no two crises are alike. Indeed, as mentioned above about regional variations in home price growth during recessions, it is worth noting that there are vast differences in absolute price levels, consumer incomes and indebtedness not only between broader geographies, but also within cities themselves. Real estate markets are, after all, a very local business. Rather than precipitate a replica of 2008, these differences, in our opinion, are likely to create a range of opportunities in the US residential market in the coming months and years.
1. Burns Home Value Index.
You are now leaving Man Group’s website
You are leaving Man Group’s website and entering a third-party website that is not controlled, maintained, or monitored by Man Group. Man Group is not responsible for the content or availability of the third-party website. By leaving Man Group’s website, you will be subject to the third-party website’s terms, policies and/or notices, including those related to privacy and security, as applicable.