With contribution from Thomas Crawford, Quant Research Analyst, Man FRM
Introduction
“The beginning of the end for government bonds.”1 “The end of bonds as ballast?”2
It feels like every crisis seems to bring new lows in government bond yields, and along with that, headlines predicting the end of bonds as an asset class.
Yet, they have proven their worth, time and again, generating returns and stabilising portfolios during market crises. The combination of risk mitigation/diversification and yield from bonds has allowed the traditional 60/40 portfolio to retain its dominance in our collective mindset.
However, with little income remaining from yield, investors are right to question the logic of hedging historically expensive equities with historically expensive bonds. Portfolio managers are left with the daunting task of finding a new risk transfer mechanism that will likely no longer be easy to statically manage nor implicitly (or explicitly) supported by central banks.
There is much to consider with respect to correlation assumptions, potential returns in crises, and possible losses should bonds sell off. However, even if bonds continue to provide uncorrelated returns and crisis ‘protection’ going forward, allocating to them at very low current yields may still render overall portfolio return objectives extremely difficult to achieve. That alone has caused investors to hunt for extra income across markets ranging from high yield to private credit. As such, investors face the complex challenge of adding risk to meet return objectives, while controlling larger potential losses from those very allocations.
In this article, we look at:
- The utility of bonds in future crises;
- Scalability, reliability and risks of possible bond replacements such as gold and currencies;
- Portfolio construction approaches embracing bonds (and leverage);
- The post bond world: controlling drawdowns in a 100% risk asset portfolio.
Thanks for the Memories
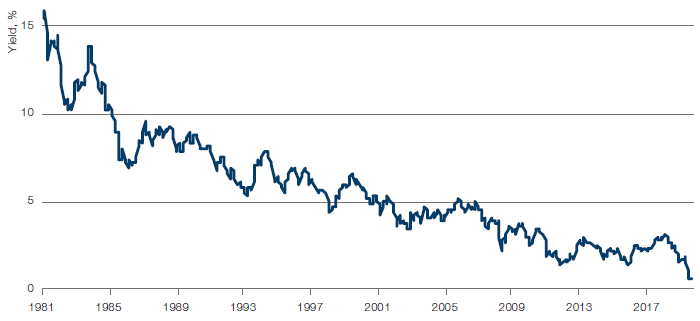
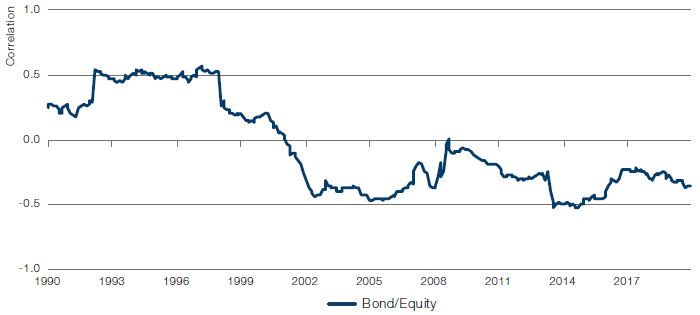
Investors have long been accustomed to bonds providing diversification, risk mitigation and, most importantly, positive returns. Yields have been declining steadily for 40 years (Figure 1), while negative correlations to equities have been a fixture throughout the 2000s (Figure 2).
Figure 1. Yields Have Been Declining
Source: Bloomberg; as of 30 September 2020.
Figure 2. Bonds Have Been Negatively Correlated to Equities for Most of the 2000s
Source: Bloomberg; as of 30 June 2020.
Portfolio managers can be forgiven for wanting to continue to hold bonds given this pattern of reliability and returns, especially during crises. However, the contribution from sovereign bonds to total portfolio has fallen dramatically over time (Figure 3).
Figure 3. Return for 10-Year Bonds by Decade
| Decade | Return |
|---|---|
| 1990-1999 | 115.6% |
| 2000-2009 | 91.8% |
| 2010-2019 | 47.8% |
| 2020-2029 | ? |
Source: Bloomberg; as of end-2019.
Total returns based on portfolio of Treasury notes with average maturity of 10 years.
With yields around 70 basis points, our analysis indicates that investors may be limited to income of 7% over the next 10 years.
Fed ‘Control’ of the Yield Curve
There is no doubt that a large part of the bond story over the last few decades has been about central banks trying to manage their economies through rates and, more recently, through aggressive bond-buying programs.
2018 was the most recent attempt by central banks to shrink balance sheets and hike rates. It would be sufficient to say it did not go well, with more than 90% of asset classes suffering losses in 2018. The reaction to stabilise markets in 2019 was a bit slow in coming, but once begun, markets rewarded central banks with large gains across asset classes.
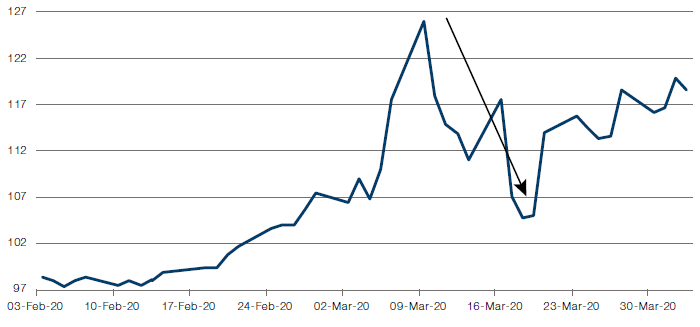
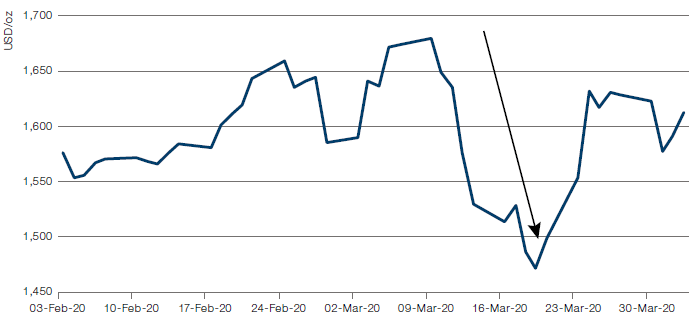
The reaction by the Federal Reserve to instability in bonds or other markets seems to be faster in 2020 and indeed, the need for markets to have Fed support increased. One need only look at Treasuries and gold in March 2020 to see what can happen when the Fed is perceived to be ‘under-reacting’ (Figures 4-5).
Figure 4. Movement in Treasuries When Fed Is Perceived to Be ‘Under-Reacting’…
Source: Bloomberg; as of 31 March 2020.
Figure 5. … And the Same in Gold
Source: Bloomberg; as of 31 March 2020.
The Fed’s package of measures to stem Treasury declines and contain spiking measures of fixed income volatility was dramatic: the MOVE index, essentially the fixed-income equivalent of the VIX and a measure of Treasury bond option-implied volatilities, plunged and now sits close to its lows, even as equity volatility remains elevated. In fact, the MOVE Index has never been this close to the VIX in the history of both indices, emphasizing the value of the Fed’s implicit control to investors.
Figure 6. VIX Versus MOVE
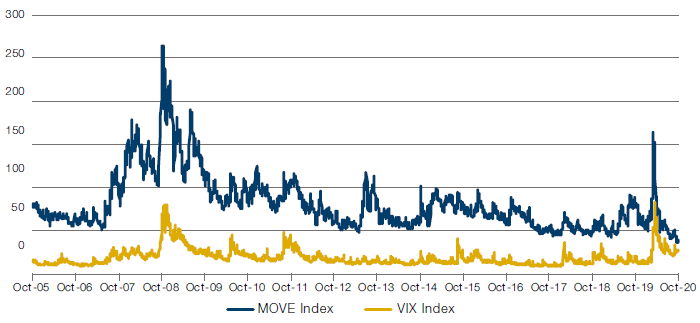
Source: Bloomberg; between 4 October 2005 and 4 October 2020.
The collapse of the MOVE Index and the end of the liquidity crisis allowed investors to focus on the risk assets in their portfolios without fear of a correlated cross-asset meltdown. That said, while this may have provided a floor to bonds, the diminished upside may mean that bonds become dead weight in portfolios, doing little for portfolios either positively or negatively.
Effectively, portfolios will be even more dominated by risk assets with little or no offset from bonds. On the other hand, if we assume the Fed will maintain control of the yield curve, the answer for investors trying to replicate prior crisis returns may be to own even more of them. Without active management, that seems a fairly daunting proposition given a move back to 2% in bonds would be painful and effects on other assets uncertain.
How Much Price Return Remains for Bonds in the Next Crisis?
There is clearly little yield to be earned in the near future. However, to evaluate the utility of bonds, we first need to establish what they have done in previous crises and whether similar returns can be expected in future market dislocations. To do this, we examine five major market events over the last 30 years. While magnitudes differ, yields uniformly went lower during crises and thus delivered the dual value of price return and positive carry for strong total returns.
Figure 7. Yields Moved Lower During Past Crises
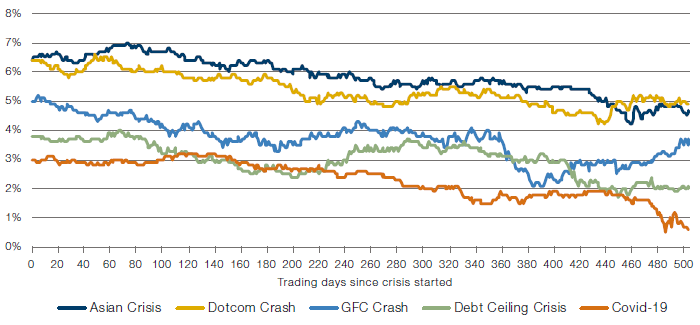
Source: Man Solutions.
Asian Crisis: 1 January 1997 – 7 December 1998; Covid-19: 30 April 2018 – 2 April 2020; Debt Ceiling Crisis: 1 January 2010 – 7 December 2011; Dotcom Crash: 1 March 2000 – 6 February 2002; Global Financial Crisis: 2 July 2007 – 4 June 2009.
In many cases, yields continued to decline – even as crises faded into memory – as the Fed continued to inject liquidity. Whether these actions were meant to support the economy or asset prices, we will not debate here.
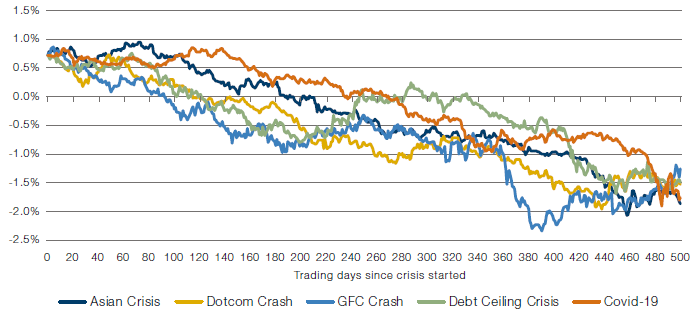
To understand how difficult those returns will be to achieve going forward, we have re-drawn the various crises, but using the recent 10-year bond yield of 70 basis points as a starting point. We project how bond yields would have had to evolve to generate equivalent returns (Figure 8).
Figure 8. How Bond Yields Would Have Had to Evolve to Generate Equivalent Returns
| Asian Crisis | Dotcom Crash | GFC Crisis | Debt Ceiling Crisis | 2018 - Covid 19 | |
|---|---|---|---|---|---|
| Starting yield | 0.7% | 0.7% | 0.7% | 0.7% | 0.7% |
| Lowest yield during crisis | -2.1% | -2.0% | -2.2% | -1.7% | -1.9% |
| Change to lowest yield | -2.8% | -2.7% | -2.9% | -2.4% | -2.6% |
| Total bond return at lows | 30.6% | 29.5% | 31.4% | 26.5% | 28.5% |
Source: Man Solutions.
Asian Crisis: 1 January 1997 – 7 December 1998; Covid-19: 30 April 2018 – 2 April 2020; Debt Ceiling Crisis: 1 January 2010 – 7 December 2011; Dotcom Crash: 1 March 2000 – 6 February 2002; Global Financial Crisis: 2 July 2007 – 4 June 2009.
The above results should be considered hypothetical as they are not based upon actual results. Please see the end of this paper for additional important information on hypothetical results.
Our analysis shows that rates would need to go decidedly negative for investors to earn the returns they did in prior events. Given Bunds and Japanese government bonds (‘JGBs’) hit lows of negative 90 basis points and negative 15 basis points, respectively, one might question if the rates below negative 1% would at all be reasonable to expect in US Treasuries. After all, bunds have returned a paltry 2.4% year to date through September 2020.
While tolerating negative yield to a certain extent, investors seem less enthusiastic about driving yields into meaningfully negative territory. This may well be more a function of future returns. Few traditional 60/40 portfolios can afford having 40% of investments with guaranteed negative yield/return over a 10-year held to maturity window. Anyone who has run a tail hedge programme from 2010-2019 will quickly point out how investors loathed paying for hedges even as equities delivered large returns. Perhaps negative yields are too much to pay for capital preservation. Or put another way, paying 109 to get back 100 in 10 years is just plain intolerable.
Returns Using Floors in Rates: Do Investors Need Even More Bonds?
While Fed Chairman Jerome Powell has long said that negative rates are not a tool the central bank is likely to use, he had also stated that buying corporate debt was not being contemplated before reversing course and even extending into high yield. As such, it could be argued that there remains enough room for potential profits in Treasuries for one more crisis, especially if one anticipates negative rates. If we set a floor of -50 basis points, it implies a move of 120 bp from the current yield of 70 bp.3 With that yield decline of 120 bp, the price return from bonds would look like 12%, leaving the portfolio with negative yield going forward. Using the Global Financial Crisis (’GFC’) as an example, due to the comparatively diminished contribution from bonds, the total drawdown of the 60/40 portfolio would have been 36% rather than 31%. In short, 120 bp would not have been enough to compensate investors for their equity drawdowns.
In effect, if bonds are needed to provide returns during crises and if there may be a floor to how low negative yields might go, investors may need to own even more of them than they do now to achieve the same historic benefit to their investment portfolios. This may seem quite counterintuitive to many who perceive significant downside in bonds. An added consideration may be that in a market with yields held stable by central banks and limited price return from bonds, the volatility profile of the 60/40 allocation may well be akin 60/0; with the important caveat being that the 40% bond portion may well sell off in a correlated bond/equity drawdown.
Portfolio Returns, Bond/Equity Correlation and Sharpe Ratios
The median pension plan return objective in the US is near 7%.4 It is therefore increasingly difficult to argue for tying up 40% of capital in sovereign bonds. With global rates at current levels, there may be little left in the way for returns going forward. As such, the future utility of bonds may be limited to their diversifying properties, which may be of benefit to a portfolio’s Sharpe ratio, but not returns. While this may be true so long as bond/equity correlations remain negative, a good Sharpe ratio does little to pay pensioners. Implicit in mentioning Sharpe ratio is that an investor is not managing risk statically, but also open to using leverage to maximise return on the portfolio. Many pensions are constrained from taking on leverage and if they did, might not feel they have adequate risk management tools in place to deal with the new level of risk. An unlevered investor, while happy to have a better Sharpe, may do little to monetise it (other than sleeping well at night).
We would stress here that the conditional to the above was “as long as correlations remain negative”. However, with potential returns quite low in bonds, the shift to a positive correlation regime could quickly undermine the argument for a levered bond/equity portfolio. The dependence on correlation assumptions appears precarious when considering that both bonds and equities are at or near historic highs. While the Fed may actively attempt to keep rates in check, stability in bonds is not the same as protection. As such, the downside volatility of the 60/40 portfolio will increase as it becomes even more equity dominant with limited potential support from bonds and reliance on governmental stimulus to protect economies.
Potential Downside in Bonds
The limited upside in bonds is already problematic for investors; however, despite investor confidence in the current negative correlation regime persisting and the Fed buying as many bonds as it takes, it is worth considering what could go wrong. Further equity and credit market recoveries may allow the Fed to let rates rise. That result may be fine in a levered portfolio holding more equites. However, to the static investor who faces little prospect of return in bonds, the loss may well have been pointless. In the 1970s, during periods of bond declines, yields were high enough that investors made back losses from price declines over the shorter time window (and net had positive returns for the decade!). However, at very low yields, that recovery of losses takes much longer. Of course, bond declines concurrent to equity and credit recovering is not nearly as lethal as all the other things we might envision going wrong:
- Inflation;
- Central banks loss of control over the yield curve;
- Sovereign credit risk;
- Return of positive correlation.
All of these require active management of the bond portfolio to navigate, in our view. Each seems unlikely on its own, but after a year in which we saw a higher VIX than 2008, oil at -USD37 a barrel and 5-year inflation break-evens approach zero, it is probably reasonable to consider how to manage through other shocks. At a minimum, the return of positive bond/equity correlations should give investors significant pause as it might undermine the hope of leverage.
Replacing Bonds and the Future of Risk Mitigation Programmes
Invariably, any discussions of the role of bonds in portfolios going forward has led to what might replace bonds. Historically, in higher yielding environments, a bond replacement would need to show some yield and positive returns during crises. This forced structurers to find a set of instruments with positive carry and then attach to those another set of instruments with duration-like features. The hope would be that the carry bucket would not hurt too much in a crash and the duration-like bucket would not cost too much between crashes. The result? Plenty of Franken-strategies were attempted with mixed results.
Given that the yields globally – be it Bunds, JGBs or US Treasuries – are quite low, we believe that perhaps the construct is different. Free of the constraint to earn yield, one could focus on generating crisis returns. Perhaps gold and foreign exchange crosses could be weighted higher in crisis risk offset plans? Many risk mitigation programmes already rely on assets beyond bonds, including: trend strategies; FX hedges (for non-US plans); and gold. Below, we briefly investigate the outlook and durability of these non-bond strategies.
Gold
Let’s start with gold, perhaps the most talked-about candidate to replace bonds. Free of the opportunity cost of yield in bonds, investors have moved into gold with the mantra that it is both a safe haven and a hedge against inflation. The bull case is furthered by the limited of supply of gold remaining to satisfy investor demand. The World Gold Council (perhaps with a bias) estimates only USD3.3 trillion of gold in the earth remaining to be mined. While this argument has existed for years, it also highlights a real constraint for portfolio constructions using gold: there is simply no realistic way for global investors holding more than USD200 trillion in financial assets to allocate any meaningful proportion their portfolios to gold. That scarcity alone may be its undoing.
On the inflation front, as argued by Man Group investment strategy advisor Professor Campbell R. Harvey5, it appears that gold has gone well beyond a level that would be expected by the US CPI index. As such, the increase in price may also be attributed to steadily declining rates and the lower opportunity cost of holding gold versus bonds. As Figure 9 illustrates, gold has been increasingly correlated to bonds since 2000 and may be sensitive to a rate shock as shown in its 13% decline in the taper tantrum of 2013. In that sense, gold effectively shares an undesirable risk attribute with bonds as a spike in rates may adversely affect almost both assets.
Figure 9. Gold Has Been Increasingly Correlated to Bonds Since 2000
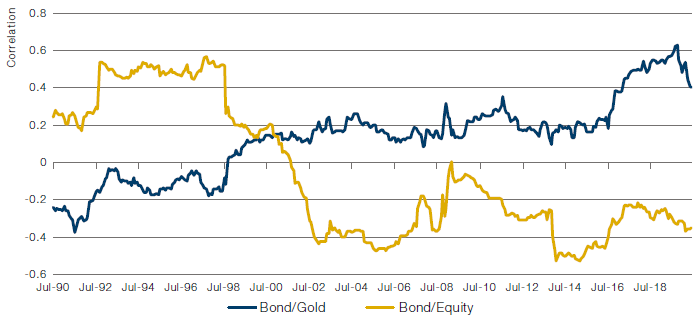
Source: Bloomberg; as of 30 June 2020.
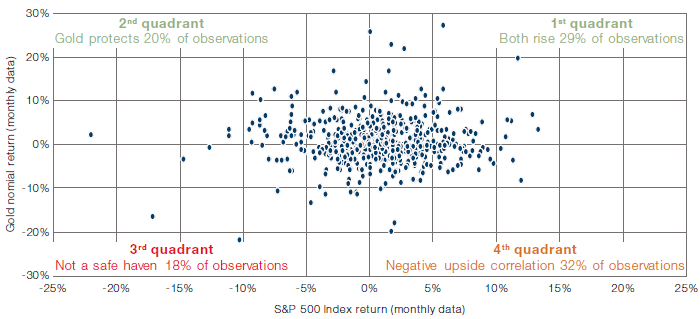
However, our primary goal is to consider whether it acts as a safe haven. Referencing and updating a chart from Harvey’s academic paper ‘The Golden Dilemma’, we find that gold sells off concurrently with equities in 18% of market observations (Figure 10). From a portfolio construction perspective, gold is already challenging given it is a 17-vol asset (similar to equities). If we add periods of positive correlation in down markets, the high volatility of gold magnifies overall portfolio volatility significantly. A true diversifier would instead reduce portfolio volatility in times of crisis. In short, it is effectively draining liquidity from the portfolio through generating losses and potentially preventing investors from making tactical decisions that may benefit their broader portfolios.
Figure 10. Gold Sells Off Concurrently With Equities in 18% of Market Observations
Source: Bloomberg; as of 30 September 2020.
Recent price movements reinforce this, as gold and equities hit year-to-date lows simultaneously in March 2020. Oddly, gold has also exhibited positive correlation with equities over the last few years. Gold may well continue to rally as funds and sentiment flow toward it; however, at least for the reasons above, it does not seem to satisfy the role of bond replacement in any broad scale.
Foreign Currencies
Non-US investors are quite accustomed to holding US dollar exposure as a form of risk mitigation for their portfolio. Tail hedge programmes often use calls on the Japanese yen and puts on many non-USD currencies to generate low cost protection. However, can currencies replace bonds in portfolio construction?
First, we have to grapple with efficacy. Tail programmes need not bother with being certain that their option strategies all work, simply because they may own options across a variety of assets and, as such, a few positions not working might not undermine the programme. While central bank interventions do at times stabilise currency movements, certain currencies have demonstrated similar returns across various crises.
Without predicting how currencies will fare in future crises, several points jump out. The recent moves in the Japanese yen have not been particularly helpful to portfolios as the currency gained 4% in the fourth quarter of 2018 and only 1% in the first quarter of 2020 (with notable volatility in March 2020). Similarly, the US dollar index moved higher only 1% in the fourth quarter of 2018 and 2% in the first quarter of 2020. The Australian dollar served as a better crisis hedge in the first quarter of 2020 incurring large declines, but since the lows, has been caught in a narrative of China recovery and potential inflation induced by central banks. This raises the possibility that currency hedges that short traditional ‘risk-off’ currencies, like the Australian dollar, may generate larger losses than expected as market regimes shift over time. While central banks are explicitly targeting inflation, markets have not priced true inflation in industrial commodities or in US 5- and 10-year inflation breakevens. However, investors should not discount the possibility as they consider the range of outcomes around their risk mitigation programmes. In any case, it seems challenging to hand off 40% of the portfolio to currencies.
Trend
Perhaps a solution is to use trend-style investments to pick up these broad asset class movements. Certainly, gold, commodities and currency markets have generated returns for trend and other systematic funds during previous crises. They may also offer more risk-limited ways to generate exposures during significant regime changes that investors may be slower to embrace, including short bonds and short dollar strategies. In The Best of Strategies for the Worst of Times, the coauthors detail how momentum strategies may generate positive return attributes during market downturns through liquid futures trading. They offer some scalability, but speed and other attributes that go into portfolio construction impact returns.
Among those choices, investors often focus most closely on speed as faster trend speeds move to short risky assets more rapidly, thus aiming to protect portfolios from market shocks that evolve over shorter time periods, as seen in the first quarter of 2020. The tradeoff for faster speed is that those strategies may, at times, trade more frequently and thus incur losses when a short-term move mean reverts or recovers quickly. In some sense, a fast trend portfolio can be thought of as similar to an options tail-hedge portfolio as those losses from these mean reversions can be thought of as similar to options premium. However, fast trend and options programmes may catch a decline more effectively than slower versions. Taken to an extreme, intraday trend strategies often are used to replicate options hedges by creating extremely fast short exposures in market declines. In order to avoid concentration risk and possibility of the strategy not delivering anticipated results, investors may simplify the discussion by implementing a variety of speeds in their trend portfolios.
In a world with bonds offering less diversification, perhaps trend, with its long-term positive Sharpe and low correlation to equities, is one ingredient to portfolio construction concerns.
Can Fiscal Response Replace Bonds and the Central Bank Put?
Powell and other global central bankers have made it a point to inform governments that, going forward, fiscal actions may become the preferred response to crises. It seems the Fed itself is starting to worry about their ability to stabilise markets going forward. While central banks may well buy all the debt created by monetary stimulus, investors have to consider the stability of that regime for risk assets. At a minimum, government action is inherently less reliable than central bank action.
Recent elections results with a Republican Senate and Democrat as President may limit the Fed’s ambition to transfer some of the crisis management of the economy and markets to the government in the form of fiscal spending. Given the Republican Senate’s previous animosity toward large-scale emergency Covid relief, it would seem difficult to expect even that level of policy response, much less a larger-scale one in an economic downturn. As such, the electorate may very well have put the onus for stability right back on Powell and the Fed. While the central banks will argue their tools are limited, in the US, there may still be room to do more. This might mean negative rates, asset purchases extending to other risk assets and even yield curve control. Regardless, investors will have to evaluate whether fiscal responses will be timely and commensurate to crises as they occur and how the Fed might respond should government responses fall short. If the burden is truly back on the Fed, the utility of bonds in the next crisis may be greater than currently appreciated.
Across the world, whatever the form of government, there needs to be agreement as to what the right stimulus should be. Different countries and regions may have very different programmes and results. Fiscal profligacy in the name supporting asset values could undermine sovereign credit ratings and currency valuations.
Although none of it appears imminent at present, the volatility effects of this shift to government spending should not be ignored. Nor should the potential aftershocks akin to the 2011 sovereign crisis in which the weakest European sovereigns came under severe pressure. After all, not everyone has the Fed’s ‘unlimited’ balance sheet. In short, regional differences and currency differences may well become the norm going forward. The net effect is that volatility across asset classes remains higher and portfolio constructions will unlikely be able to rely on fiscal response to the same degree as they might have relied on central banks.
Portfolio Construction Embracing Bonds
Given the challenges that seem to exist with replacing bonds, perhaps the right portfolio construct is to choose one of two paths: (1) embrace bonds, add more of them and manage the risk; or (2) simply remove government bonds from the portfolio entirely, while seeking other forms of risk mitigation.
In the former, the move toward risk parity is based on scalability, continuing negative correlation of bonds and equities, anticipated positive price return during crises, and modest positive carry from leveraged bond exposure. If the Fed implicitly or explicitly controls the yield curve, that works to the bond owner’s advantage by potentially removing risk of correlated equity and bond declines. A move to negative rates in the US would still be of benefit to bond holders during crises.
However, as bond yields are low, simply adding more bonds may not need to be enough to achieve return objectives. As discussed above, Sharpe ratio improvements without adding much return do little for investors. As such, leverage may be required. With leverage comes the importance of risk controls, especially ones sensitive to bond equity correlation changes that may undermine the portfolio severely. The entire approach is summarised in Man Group’s article ‘Portable Exposure Management’.6 Overall, the approach based on embracing bonds, using leverage and employing required risk controls has been well-discussed in other published research and thus, we are free to move on to the other approach: giving up on Treasury bonds.
A New 60/40: Making Strategic Risk Control Part of the Strategic Allocation
Investors have long been comfortable with the 60/407 portfolio based on returns, realised volatility and maximum drawdowns. While it is in no way optimised, it has persisted as a simple fit to an allocation problem. Unfortunately, our analysis estimates that the return outlook for the traditional 60/40 seems is unlikely to meet the average return objective for pension of 7%.8 As such, investors are left with the stark choice of either taking more risk/leverage or hoping equities will pick up all the missing return from bonds. They will be doing so hoping that bonds do not sell off and bond/equity correlations remain stable.
The balance of this article focuses on moving from a traditional 60/40 portfolio to one that allocates 100% to risk assets with the addition of risk controls to replace the positive risk attributes of bonds. Rather than attempting to find bond replacements, we believe the better approach may be to make active exposure management techniques and risk controls a part of the strategic allocation. As a practical matter, many pensions have already moved further out on the risk curve: favouring credit over Treasuries for yield, utilising portable alpha as a form of leverage and private equity as a smoothed return equity investment. However, these steps are incremental. We would argue for simply embracing the weight of risk assets and risk controls at once.
In contemplating what pension portfolios might look like going forward, an easy approach to evaluating a successor portfolio is to ensure that whatever new design we implement matches the volatility and drawdown characteristics of the original 60/40; in short, expected annual returns of 5-6%, volatility of around 10% and a maximum drawdown of 36%. With that extremely basic framework, we can proceed. Note that we have ignored the Sharpe ratio for now. While a good Sharpe should be important to investors, those limited by the amount of leverage they can take are primarily interested first in returns and second in drawdown. To them, Sharpe may simply be a descriptive element. We create a few hypothetical portfolios as a means of discussing the continuum of possibilities for investments going forward. First, we start with 60/40 assuming current yield of 70 bp and a zero-yield boundary. While it is possible on a gap move that rates go negative, over time, the negative yield will reflect in returns. As such, we assume a zero floor to the bond portfolio for illustrative purposes. As an initial glance at a ‘risky’ portfolio, we then use a 100% allocation to the MSCI All Country World Index. Finally, we make an equity/credit portfolio which we detail after the table.
Figure 11 shows simulated returns for different strategies between March 2005 and June 2020. This includes degrading yields for Treasuries and yield portfolios shown in light blue:
Figure 11. Simulated Returns for Different Strategies
| Annual Return | Volatility | Sharpe | GFC Drawdown | Max Drawdown | Covid Drawdown | |
|---|---|---|---|---|---|---|
| 60/40 (Hist Actual) | 5.2% | 10.28% | 0.35 | 30% | 36% | 19% |
| 60/40 Zero yield | 3.9% | 9.44% | 0.41 | 29% | 37% | 22% |
| 100/0 ACWI | 6.1% | 15.73% | 0.32 | 49% | 57% | 31% |
| 60/40 Aggressive Yield (Using Current Yields) | 6.0% | 11.41% | 0.53 | 37% | 44% | 25% |
Simulated past performance is not indicative of future results. Returns may increase or decrease as a result of currency fluctuations.
Source: Man Solutions; Between March 2005 and June 2020.
Simulated performance data and hypothetical results are shown for illustrative purposes only, do not reflect actual trading results, have inherent limitations and should not be relied upon. Please see the end of this paper for additional important information on simulated results.
In the past, Treasury yields have been sufficient to meet a basic income requirement that endowments, pensions or other investors may have. While equities clearly have yield, investors seem unlikely to place much faith in dividends and may find the associated crash risk too severe. As such, one of the broad comments we frequently hear from institutional clients is that they cannot go to an all-equity portfolio as they “need” to have some yield. In these cases, one can add a portfolio called 60/40 ‘aggressive yield’. The 40 is allocated to a portfolio of high yield, private credit, real estate debt, direct lending and equity yield among others (see below). As yields and credit spreads are lower than much of the tested period, we re-run the aggressive yield portfolio historic simulations based on the lower current yield environment. This allows us to evaluate drawdowns, but also returns more consistently.
Whether 6% returns in equities is achievable is debatable. However, the goal of this framework is to set baseline for risks and potential returns. The 60/40 based on current Treasury yields would have generated 3.9% return with 37% drawdown. That forms a reference point to which we can compare other portfolios.9 A 100% allocation to equities shows 6.1% returns, but with a high 15.7% volatility and an unacceptable drawdown of 57%. Adding the credit strategy dramatically cuts portfolio volatility. With similar returns to a 100% equity portfolio, at first glance, the Sharpe of 0.53 may appear satisfying; however, the drawdown of 44% remains rather intolerable. That said, high yield is at least somewhat diversifying and thus, with the right risk controls may be a valuable tool.
Adding Risk Control
While portfolios going to 100% long risk profiles may achieve return objectives, they clearly lack some of the risk mitigating benefits of bonds. As such, a first approach to portfolio construction might be to design some sort of sleeve/allocation to investments that offer bond-like diversification and risk benefits.
Given that yields globally – be it Bunds, JGBs and US Treasuries – are quite low, we have a different set of constraints than historically has been the case in replicating bonds. When yields on Treasuries were higher, a bond replacement would need to show some yield along with positive returns during crises. Free of the requirement to earn yield, we can focus on generating crisis returns. That has broad implications for asset allocations. Replicating the positive risk attributes may be through a combination of active exposure management tools in the form of risk-based futures overlays, trend investments and multi-asset tail hedges. They share cash efficiency at their core. Historically, those types of risk-mitigating portfolios might show mixed or even negative returns in strong markets discouraging investors needing yield in their struggle to hit return objectives. However, with no forced attempt at creating yield, a hedge portfolio can be more focused on generating positive returns in market dislocations. The point of this exercise in risk control is to be able to increase allocations to risky assets while containing downside losses.
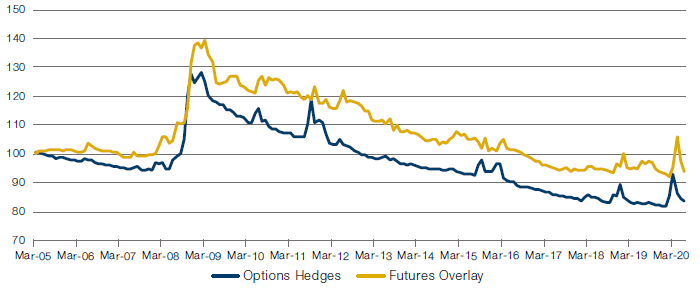
The basic problem with using risk-mitigating strategies is one of cost or losses generated between crises. Investors myopically focused on drag from 2010-2019 rather than returns generated by risk assets that could be more comfortably held with those strategies in place. Most typically, those conversations focus on a straightforward return history of tail hedges: big gains in crises that evaporate over time, while ignoring the impact on portfolio volatility and drawdowns during those events. Figure 12 shows a rolling 1-year 85% put strategy and an equity futures-based risk control strategy based on volatility scaling, momentum and cross asset correlations. Gains are recorded during crises, followed by long drawdowns.
Figure 12. Option Hedges and Futures-Based Equity Overlays
Simulated past performance is not indicative of future results. Returns may increase or decrease as a result of currency fluctuations.
Source: Man Solutions; Between March 2005 and June 2020.
Simulated performance data and hypothetical results are shown for illustrative purposes only, do not reflect actual trading results, have inherent limitations and should not be relied upon. Please see the end of this paper for additional important information on simulated results.
Tail-hedging programmes are likely well known by investors; however, it is worth describing the components of the futures overlay and how they work. A primary risk tool is one based on controlling portfolio volatility, often referred to as volatility scaling, as described in The Impact of Volatility Targeting’:
One of the key features of volatility is that it is persistent, or clusters. High volatility over the recent past tends to be followed by high volatility in the near future. This observation underpins Engle’s [1982] pioneering work on autoregressive conditional heteroskedasticity (‘ARCH’) models. In this article, we study the risk and return characteristics of assets and portfolios that are designed to counter the fluctuations in volatility. We achieve this by leveraging the portfolio at times of low volatility and scaling down at times of high volatility. Effectively, the portfolio is targeting a constant level of volatility, rather than a constant level of notional exposure ... Doing so reduces the likelihood of extreme returns (and the volatility of volatility). In particular, the lower probability of very negative returns (left-tail events) is valuable for investors.
By using futures as a proxy for the equity risk of the portfolio, we can manage risks of a diverse portfolio rather than selling specific portfolios, equities or credits. To volatility scaling, we add additional risk overlays based on momentum signals, cross-asset correlation and one measuring correlations across equities. By applying these overlays to equity only portfolios, drawdowns can potentially be reduced at the cost of a drag to return between crises.
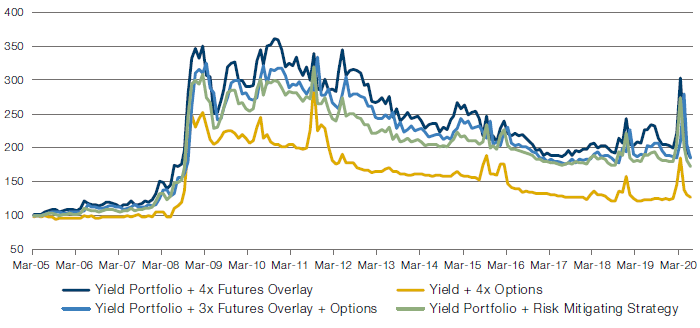
As investors frequently avoid strategies with explicitly negative returns between crises, we could create a yield portfolio from junk bonds, private credit or even equities to fund a robust package of risk-mitigating strategies. The goal for the portfolio would be to generate either no return or small losses in rallies and outsize gains in a decline. One could invest in the aforementioned yield portfolio and use all the simulated return to simultaneously invest risk-mitigating strategies. As an example, a 10% portfolio allocation to the yield portfolio could invest in in risk mitigating strategies covering 30-40% of the overall portfolio. Figure 13 depicts various permutations of that portfolio.
Figure 13. Yield Portfolio Plus Risk-Mitigating Strategies
Source: Man Solutions; as of 30 June 2020.
Simulated performance data and hypothetical results are shown for illustrative purposes only, do not reflect actual trading results, have inherent limitations and should not be relied upon. Please see the end of this paper for additional important information on simulated results.
While the returns are positive over time with large benefits in 2008/2020, they show large losses from peaks. Mostly, it is often difficult for investors to believe in the ostentatious results and envision the application to the portfolio even as a 10% sleeve. In short, as a product for investors, we believe it is a rather baffling return stream. The returns might further benefit from monetisation and a more strategic implementation, but we have omitted in doing so here.
As a side note, we rarely find that using only one approach to risk mitigation is sufficient and thus, prefer a combination of approaches based on market conditions. Options-only strategies, while effective in the Covid crisis, often show higher drag than other systematic strategies. Given differing risk and return attributes for each, one can create a ‘Risk-Mitigating Strategy’ (‘RMS’) that moves between 25-50% allocation to options and 50-75% to a futures overlay based on relative cheapness of volatility. In effect, buying options is akin to outsourcing risk management to the market. As such, when volatility is low, one would invest more in options for convexity and when high, rely on systematic programs to accomplish the goal.
Integrating the Risk Mitigating Strategy Into a Broader Portfolio
By making the decision to integrate a risk-mitigating strategy into the strategic allocation, a much different and coherent set of returns emerges. As a start, we again run simulations on equity-only portfolios with a variety of risk overlays. First, the traditional 60/40 and 100/0 equities are used as reference points. We then run simple option hedges against the portfolio (1-year rolling 85% puts) and the suite of risk overlays against 90-100% of equity exposure. Note that with a futures programme, we place 10% of the portfolio in cash to meet margin requirements.
Figure 14. Integrating the Risk Mitigating Strategy Into an Equity-Only Portfolio
| Annual Return | Volatility | Sharpe | GFC Drawdown | Max Drawdown | Covid Drawdown | |
|---|---|---|---|---|---|---|
| 60/40 Zero yield | 3.9% | 9.44% | 0.41 | 29% | 37% | 22% |
| 100/0 ACWI | 6.1% | 15.73% | 0.39 | 49% | 57% | 31% |
| 100 ACWI Options hedged | 6.0% | 10.04% | 0.60 | 25% | 33% | 8% |
| 90% ACWI Futures Overly | 6.5% | 11.37% | 0.57 | 26% | 31% | 9% |
| 90% ACWI + Risk Mitigation Strategy | 6.4% | 10.77% | 0.59 | 25% | 32% | 9% |
Simulated past performance is not indicative of future results. Returns may increase or decrease as a result of currency fluctuations.
Source: Man Solutions; Between March 2005 and June 2020.
Simulated performance data and hypothetical results are shown for illustrative purposes only, do not reflect actual trading results, have inherent limitations and should not be relied upon. Please see the end of this paper for additional important information on simulated results.
Over the last 30 years, markets have experienced three drawdowns of 30% or more in equities. As such, using hedges has had a beneficial impact on the portfolio in almost any 10-year window. The net impact is to have lower portfolio volatility and drawdowns. Importantly, the drawdowns are below that of the traditional 60/40 portfolio, while still allowing for 100% of the upside risk in equities with much lower downside capture. We use primarily 6-month to 1-year options and avoid using only S&P 500 options the MSCI All Country World Index better represents a globally invested equity portfolio.
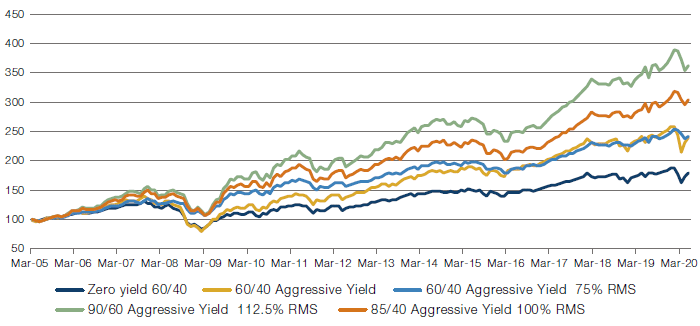
The equity-only portfolio lacks diversification and only generates yield via potentially unstable dividends. Returning to our aggressive-yield portfolio, we attack the drawdown in a similar fashion to the one used in equities. However, thanks to the diversification benefit of credit (and lower overall drawdown), we reduce the percentage of the RMS allocation from 100% to 75%. The initial results in Figure 15 show dramatic cuts in drawdown and portfolio volatility. The new levels may even open the door to some use of leverage. We show the portfolio at 1.5 times leverage. Understanding that not every pension will leap from 60/40 to 90/60, we add one final variation that simply adds a bit more equity risk with an 85/40 allocation.
Figure 15. Integrating the Aggressive-Yield Portfolio
| Annual Return | Volatility | Sharpe | GFC Drawdown | Max Drawdown | Covid Drawdown | |
|---|---|---|---|---|---|---|
| 60/40 Zero yield | 3.9% | 9.44% | 0.41 | 29% | 37% | 22% |
| 60/40 Aggressive Yield (Current Yield) | 6.0% | 11.41% | 0.53 | 37% | 44% | 25% |
| 60/40 Aggressive Yield (75% RMS) | 6.1% | 7.52% | 0.80 | 17% | 22% | 7% |
| 90/60 Aggressive Yield (112.5% RMS) | 9.0% | 11.29% | 0.80 | 27% | 32% | 10% |
| 85/40 Aggressive Yield (100% RMS) | 7.7% | 10.15% | 0.76 | 24% | 30% | 8% |
Source: Man Solutions; as of 30 June 2020.
Figure 16. 60/40 Aggressive Yield Plus Risk Overlay Permutations
Simulated past performance is not indicative of future results. Returns may increase or decrease as a result of currency fluctuations.
Source: Man Solutions; Between March 2005 and June 2020. Simulated performance data and hypothetical results are shown for illustrative purposes only, do not reflect actual trading results, have inherent limitations and should not be relied upon. Please see the end of this paper for additional important information on simulated results.
By combining the diversifying properties of credit instruments with active risk controls, the portfolio winds up with better risk metrics and returns. While we use 60/40 allocation between equities and credit, investors can design different combinations to suit their needs. The goal is to create opportunity for returns through allocation to risk assts while controlling potential drawdowns.
Conclusion
For years, investors have benefitted from the simplicity of the 60/40 portfolio. This may result in futility. After all, this is basically hedging historically expensive equities with historically expensive bonds. Assumptions about bond/equity correlations and the Fed’s ability to control yields may also challenge investors.
So, what’s the alternative? Gold? Currencies? We believe they may show even more troubling risk attributes. They have delivered mixed results in recent crises, lack the central bank support that markets have become accustomed to with bonds and may behave differently than expected as market regimes shift. A new reliance on fiscal stimulus to replace central bank support likely introduces more volatility across asset classes.
As markets struggle with bond replacements, we believe that an alternative solution may reside in giving up on that search entirely. With dauntingly high return objectives, investors may have little choice other than to add leverage in their traditional 60/40 portfolios or to move from low yielding bonds into a 100% allocation to risky assets. Either approach may require much deeper levels of risk controls around volatility and cross-asset correlations. While high yield and other risky assets are more diversifying than commonly believed, the downside beta to equities of credit instruments cannot be ignored. By integrating risk control into the portfolio process, investors can potentially control drawdowns, realise this diversification benefit and access higher returning assets. The goal is to create a portfolio dedicated to credit and equities with risk characteristics that improve upon the historical drawdown and volatility of the traditional 60/40 allocation.
We argue that all of this means going beyond ad-hoc tail-hedge programmes or occasional futures-based hedges and moving to a dedicated allocation to active exposure management. 2020 has challenged investors in many different ways and the aftershocks may be felt for years to come. However, the reward for properly designed risk-mitigating programmes may be the opportunity to achieve return objectives that might otherwise be challenging to achieve.
1. Source: TwentyFour AM; as of 27 April 2020.
2. Source: Reuters; as of 3 July 2020.
3. As of 30 September 2020.
4. Source: Goldman Sachs; as of 30 June 2020.
5. Source: The Golden Dilemma; Claude E. Erb, Campbell R. Harvey; January 2013.
6. Available upon request.
7. 60/40 portfolio based on 60% allocation to MSCI All Country World Index and 40% to Barclays Global Treasury Index.
8. Source: Goldman Sachs; as of 30 June 2020.
9. 40% allocated among the following: 6% S&P/LSTA Leveraged Loan Price Index, 12% IBOXX High Yield Index, 4% ICE BofA Corporate Bond Index, 2% JP Morgan Emerging Market Bond Index, 6% ICE US fixed rate CMBS Index, 6% MSCI High Dividend Yield Equity Index, 4% Cliffwater Direct Lending Index.
Hypothetical Results
Hypothetical Results are calculated in hindsight, invariably show positive rates of return, and are subject to various modelling assumptions, statistical variances and interpretational differences. No representation is made as to the reasonableness or accuracy of the calculations or assumptions made or that all assumptions used in achieving the results have been utilized equally or appropriately, or that other assumptions should not have been used or would have been more accurate or representative. Changes in the assumptions would have a material impact on the Hypothetical Results and other statistical information based on the Hypothetical Results.
The Hypothetical Results have other inherent limitations, some of which are described below. They do not involve financial risk or reflect actual trading by an Investment Product, and therefore do not reflect the impact that economic and market factors, including concentration, lack of liquidity or market disruptions, regulatory (including tax) and other conditions then in existence may have on investment decisions for an Investment Product. In addition, the ability to withstand losses or to adhere to a particular trading program in spite of trading losses are material points which can also adversely affect actual trading results. Since trades have not actually been executed, Hypothetical Results may have under or over compensated for the impact, if any, of certain market factors. There are frequently sharp differences between the Hypothetical Results and the actual results of an Investment Product. No assurance can be given that market, economic or other factors may not cause the Investment Manager to make modifications to the strategies over time. There also may be a material difference between the amount of an Investment Product’s assets at any time and the amount of the assets assumed in the Hypothetical Results, which difference may have an impact on the management of an Investment Product. Hypothetical Results should not be relied on, and the results presented in no way reflect skill of the investment manager. A decision to invest in an Investment Product should not be based on the Hypothetical Results.
No representation is made that an Investment Product’s performance would have been the same as the Hypothetical Results had an Investment Product been in existence during such time or that such investment strategy will be maintained substantially the same in the future; the Investment Manager may choose to implement changes to the strategies, make different investments or have an Investment Product invest in other investments not reflected in the Hypothetical Results or vice versa. To the extent there are any material differences between the Investment Manager’s management of an Investment Product and the investment strategy as reflected in the Hypothetical Results, the Hypothetical Results will no longer be as representative, and their illustration value will decrease substantially. No representation is made that an Investment Product will or is likely to achieve its objectives or results comparable to those shown, including the Hypothetical Results, or will make any profit or will be able to avoid incurring substantial losses. Past performance is not indicative of future results and simulated results in no way reflect upon the manager’s skill or ability.
You are now leaving Man Group’s website
You are leaving Man Group’s website and entering a third-party website that is not controlled, maintained, or monitored by Man Group. Man Group is not responsible for the content or availability of the third-party website. By leaving Man Group’s website, you will be subject to the third-party website’s terms, policies and/or notices, including those related to privacy and security, as applicable.