Introduction
Many investors don’t realise that a mechanical rebalancing strategy, such as a monthly or quarterly reallocation towards fixed portfolio weights, is an active strategy. Winning asset classes are sold and losers are bought. During crises, when markets are often trending, this could lead to larger drawdowns than a buy-and-hold strategy. We show that these drawdowns induced by naïve rebalancing could be mitigated, taking the popular 60-40 stock-bond portfolio as our use case.
One alternative is an allocation to a trend-following strategy. This type of strategy has the potential to do better in periods of extreme negative returns and help counterbalance the rebalancing strategy. The second alternative we call strategic rebalancing, which uses smart rebalancing timing based on trend-following signals – without a direct allocation to a trend-following strategy. For example, if the trend-following model suggests that stock markets are in a negative trend, rebalancing is delayed.
Of course, a pure buy-and-hold portfolio has the drawback that the asset mix tends to drift over time and, as such, is untenable for investors who seek diversification. For a US stock-bond portfolio, an initial 60% of capital allocated to stocks in 1927 drifts to a 76% allocation by 1929, a 32% allocation by 1932, and a level close to 100% over time, as stocks tend to outperform bonds over the long run (Figure 1).
Figure 1: Allocation to Stocks for an Initial Capital Weighted 60-40 Stock-Bond Portfolio
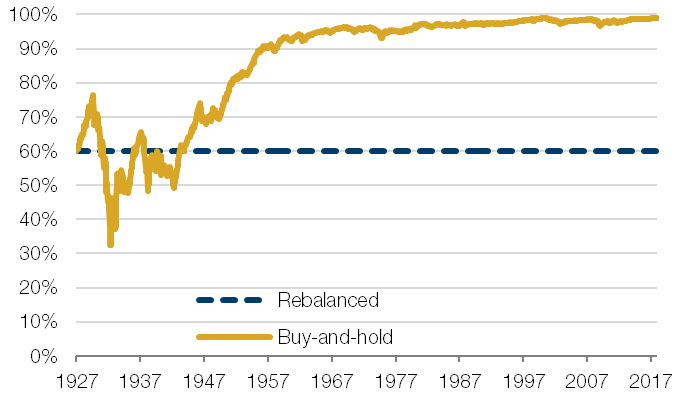
Source: Federal Reserve, Kenneth French website, Global Financial Data; Between January 1927 and December 2017.
However, a stock-bond portfolio that regularly rebalances tends to underperform a buy-and-hold portfolio at times of continued outperformance of one of the assets. Intuitively, this is because rebalancing means selling (relative) winners, and if winners continue to outperform, that detracts from performance.
Comparing Rebalanced And Buy-And-Hold Portfolio Returns
As stocks typically have more volatile returns than bonds, relative returns tend to be driven by stocks. Hence, of particular interest are episodes with continued negative (absolute and relative) stock performance, such as the 2007-2009 global financial crisis. In Figure 2, we contrast the monthly-rebalanced and buy-and-hold cumulative performance over the financial crisis period, where both start with an initial 60-40 stock-bond capital allocation.1 The maximum drawdown of the monthly-rebalanced portfolio is 1.2 times (or 5 percentage points) worse than that of the buy-and-hold portfolio, right at the time when financial markets turmoil is greatest.
Figure 2: Performance Monthly-Rebalanced and Buy-and-Hold Portfolios During the Global Financial Crisis
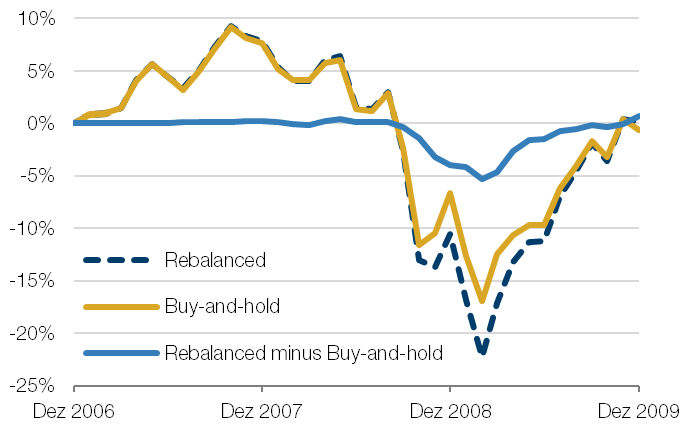
Source: Federal Reserve, Kenneth French website, Global Financial Data; Between January 2007 and December 2009.
In earlier work, Granger et al. (2014) formally show that rebalancing is similar to starting with a buy-and-hold portfolio and adding a short straddle (selling both a call and a put option) on the relative value of the portfolio assets.2 The option-like payoff to rebalancing induces negative convexity by magnifying drawdowns when there are pronounced divergences in asset returns.
Allocation To Trend
Indeed, our empirical analysis shows that time-series momentum (or trend) strategies, applied to futures on the same stock and bond markets, may act as natural complements to a rebalanced portfolio. This is because the trend payoff tends to mimic that of a long straddle option position, or exhibits positive convexity, see, e.g., Martin and Zou (2012)3 and Hamill, Rattray, and Van Hemert (2016).4
Our main analysis is for the 1960-2017 period, which includes the bond bear market of the 1960 and 1970s, but omits the different bond regime before 1960.5 We evaluate how 1-, 3-, and 12-month trend strategies perform during the five worst drawdowns for the 60-40 stock-bond portfolio. In our analysis, allocating 10% to a trend strategy and 90% to a 60-40 monthly-rebalanced portfolio improves the average drawdown by about 5 percentage points, compared to a 100% allocation to a 60-40 monthly rebalanced portfolio. The trend allocation has no adverse impact on the average return over our sample period. That is, while one would normally expect a drag on the overall (long-term) performance when allocating to a defensive strategy, in our sample, the trend-following premium earned offsets the cost (or insurance premium) paid.6
Strategic Rebalancing Versus A Direct Allocation To Trend
An alternative to a trend allocation is strategically timing and sizing rebalancing trades, which we label strategic rebalancing. We first consider a range of popular heuristic rules; varying the rebalancing frequency, using thresholds, and trading only partially back to the 60-40 asset mix. Such heuristic rules reduce the average maximum drawdown level for the five crises considered by up to 1 percentage point. However, using strategic rebalancing rules based on either the past stock or past stock-bond relative returns gives improvements of 2 to 3 percentage points.
Strategic Rebalancing
In Figure 3, we show the impact on the drawdown level of the types of trend exposures we discussed. Concretely: a 10% allocation to a 12-month stocks and bonds (equal risk) trend strategy and a strategic rebalancing rule to delay rebalancing if the 12-month stock-bond spread trend is negative. The main takeaway is that either a direct allocation to a trend strategy or using trend signals as a basis of a rebalancing rule tends to reduce the drawdown materially. The performance around Black Monday is the only exception here in case of an allocation to trend (less so for the strategic rebalancing rule).
Figure 3: Impact of Adding a Trend Exposure on the Portfolio Drawdown Level
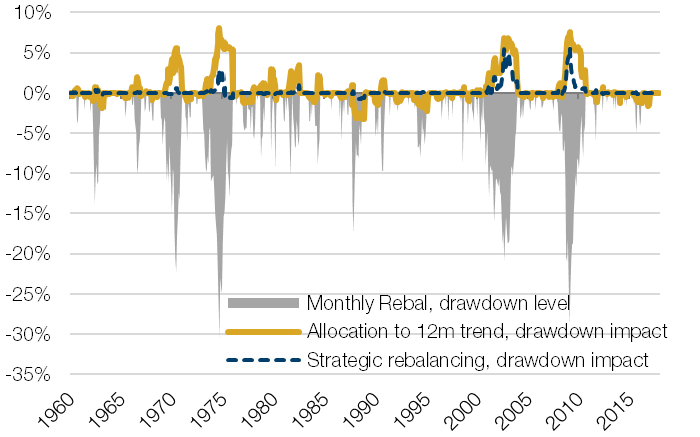
Source: Federal Reserve, Kenneth French website, Global Financial Data; Between January 1960 and December 2017.
Conclusion
A pure buy-and-hold portfolio may be untenable for many investors as it leads to a highly concentrated, undiversified portfolio. However, a 60-40 stock-bond portfolio that rebalances every month to the 60:40 target ratio loses several percentage points more than a buy-and-hold portfolio during periods of continued stock market drawdowns.
Negative convexity induced by rebalancing could be effectively countered with a trend exposure, which exhibits positive convexity and can be either implemented as a direct allocation to a trend investment product or with a strategic trend-based rebalancing rule.
While our focus is on countering the negative convexity induced by rebalancing, other considerations matter in practice as well. For example, investors can also use monthly in- and out-flows to move back toward the target asset mix. For taxable investors, rebalancing using income has the added potential benefit that no assets need to be sold, which can be tax efficient; see Colleen, Kinniry, and Zilbering (2010).7
Finally, a stock-bond trend exposure is just one way to mitigate drawdowns at times of continued stock market losses. An investor has more arrows in her quiver. A good starting point is a more diversified portfolio that includes more asset classes and has an international exposure. An allocation to a broader trend strategy that benefits from trends in other macro assets at times of equity market distress may further dampen equity market losses; see Hamill, Rattray, and Van Hemert (2016). Additionally, Harvey et al. (2018) study volatility targeting and show that it can help manage the risk of a 60-40 stock-bond portfolio.8
1. For our empirical analysis, we use we use monthly value-weighted returns of firms listed on the NYSE, AMEX, and NASDAQ from Kenneth French's website. For bonds, we use US Treasury bond data from the Federal Reserve.
2. Granger, N., D. Greenig, C.R. Harvey, S. Rattray, D. Zou (2014), “Rebalancing risk”, SSRN working paper: https://ssrn.com/abstract=2488552.
3. Martin, R. and D. Zou. (2012), “Momentum trading: ‘skews me”, Risk, 25(8), 52-57.
4. Hamill, C., S. Rattray, and O. Van Hemert (2016), “Trend following: equity and bond crisis alpha”, SSRN working paper https://ssrn.com/abstract=2831926.
5. See also Harvey et al. (2018) for a discussion on the different US bond regimes.
6. We find that the performance of trend strategies is consistent over time, not driven by any particular sub-period.
7. Colleen, J., F. Kinniry, and Y. Zilbering (2010) “Best practices for portfolio rebalancing”, Vanguard working paper.
8. Harvey, C. R., E. Hoyle, Russell Korgaonkar, S. Rattray, M. Sargaison, and O. Van Hemert (2018), “The impact of volatility targeting”, Journal of Portfolio Management, 45(1), 14-33.
You are now leaving Man Group’s website
You are leaving Man Group’s website and entering a third-party website that is not controlled, maintained, or monitored by Man Group. Man Group is not responsible for the content or availability of the third-party website. By leaving Man Group’s website, you will be subject to the third-party website’s terms, policies and/or notices, including those related to privacy and security, as applicable.