Introduction
In our paper, Separating Alpha from Smart Beta, published earlier this year, we presented a framework for decomposing active manager returns into two components: first, the part that is driven by popular and easily replicable single-factor ‘Smart Beta’ ETFs, and second, the part that is the manager’s pure alpha. This follow-up paper takes that initial analysis, which focused on US Large Cap Core Managers from October 2013 to December 2016, and extends it to international manager universes over a longer time period. We will also examine the differences between quantitative and fundamental managers in different regions.
Recap: our framework for separating alpha from Smart Beta
As detailed in our first paper on this subject, our research uses a number of metrics to distinguish real investment skill from broader market dynamics.
Our framework conducts regression analysis on a portfolio’s active return against the market (beta), plus a number of smart beta factors (for example, Size, Value, Momentum and Quality). We calculate the exposure of a portfolio to each of these variables, allowing us to isolate pure alpha (the intercept in our equations) and then use the R-squared of the regression to show how much of a strategy’s return is attributable to these generic factors.
The primary goal of this research is the same as the original paper, aiming to answer a central question in relation to active investment strategies: has the manager generated real idiosyncratic alpha over and above generic Smart Beta factors? However, our extended research delves a layer deeper in attempt to address several specific points which underpin this central question. This article is intended to give a brief snapshot of our research and findings.
- How do quantitative and fundamental managers differ? Which is likely to produce returns driven by Smart Beta, as opposed to pure alpha?
- How do regional managers differ?
- Is high active share and high tracking error always better?
- Do you get what you pay for in active management?
Extending the analysis – using generic factors as a proxy for smart beta
A key benefit of the original analysis was that we used the actual Smart Beta ETF returns, which created a realistic view of the Smart Beta characteristics after cost. However, one of the limitations was that these Smart Beta ETFs only dated back to mid-2013, with even shorter histories for factors outside the US. To conduct a longer, more robust analysis, our extended research uses generic Barra factors as a proxy for Smart Beta ETF strategies: factors such as Value, Size, Momentum, and Leverage. Like our original analysis, the factors are constructed on a long/short basis and are sector neutral. While they do not include rebalancing costs or management fees, and are therefore not a perfect representation of Smart Beta, they are highly correlated to the ETF returns, and we believe they are appropriate for our analysis. With these parameters identified, we were able to run regression analysis on monthly returns of the eVestment Global Large Cap Core universe for the five years ending December 2016. This universe contains around 120 managers.
Analysis of Global Core universe: quantitative versus discretionary
By extending our original analysis across a global investment universe – beyond just US large cap – we are able to think in the broadest terms about active equity management. A common debate in our industry is about whether quantitative or discretionary managers are the best placed to generate ‘pure’ alpha. Many investors argue that quantitative investment strategies, with rules-based methodologies and highly diversified exposures, may be particularly vulnerable to the presence of broad risk factors.
On the other hand, discretionary managers who align themselves to particular styles may also see their performance driven by forces beyond their own alpha (for example, Value managers who experience strong performance when this factor is in favor, and vice versa). Using regression analysis, we charted the adjusted R-squared and monthly intercept of strategies in the eVestment Global Large Cap Core universe. Figure 1 illustrates this, showing that both quantitative and fundamental managers average around the same intercepts over this period. Perhaps unsurprisingly, quantitative managers tend to have a higher R-squared, meaning that more of their returns may be explained by the Smart Beta factors.
Figure 1. R-squared versus intercept – eVestment Global Large Cap Core Universe (5y ending Dec 2016)
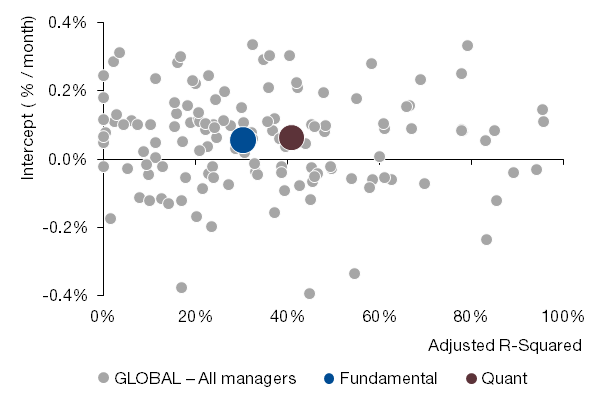
Source: eVestment and Man Numeric, 2017. For illustrative purposes only. Fundamental and Quant refer to the averages for fundamental and quantitative managers.
Of course, another way to use the analysis is to look at the relationship of the intercept and the actual excess return of a strategy. We outlined this in our first paper, where ideally, investors in active strategies would see returns distributed along a 45 degree line (Figure 2) where actual reported alpha equals the intercept, or true independent alpha. Managers whose returns lie below the line are delivering ‘alpha’ that is actually driven by Smart Beta factors – potentially representing a poor deal for clients paying for active management. Managers whose returns lie above the line are in an unenviable situation where their positive skill or alpha is overshadowed by poor portfolio returns versus their benchmark. This is an area where we believe asset owners may be able to find ‘diamonds in the rough'.
Figure 2. Recap of Smart Beta return analysis – reported alpha vs regression intercept
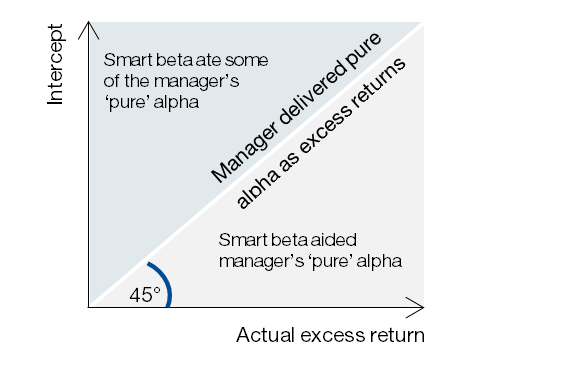
Source: Man Numeric, 2017. For illustrative purposes only.
In this extension of our analysis, we plotted the Global Core universe in this way, again looking to compare quantitative versus fundamental managers. Figure 3 shows how most managers – quantitative or fundamental – lie close to the 45 degree line, implying that most of their alpha is indeed independent of Smart Beta factors over this period. The quantitative manager average is very close to the bisecting line, with a 7bps/month intercept and realized alpha of 6bps/month. The fundamental manager average has a similar intercept (as we saw in Figure 1), but the actual excess return versus their stated benchmark is only 3bps/month. This indicates that fundamental managers, on average, had exposures to Smart Beta factors which detracted from their pure skill. Figure 3 highlights a group of managers who lie above the 45 degree line, who have positive idiosyncratic alpha, but smaller – or even negative – reported excess return versus the benchmark. These managers may be diamonds in the rough.
Figure 3. Intercept versus actual excess returns – spotting diamonds in the rough
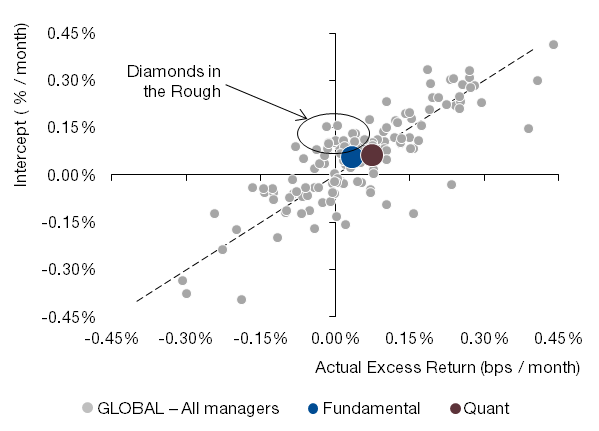
Source: eVestment and Man Numeric, 2017. For illustrative purposes only.
Regional differences
Another extension of our research is the application of this framework to managers in different global regions. Figure 4 charts the reported alpha versus the intercept across fundamental and quantitative managers in all regions in the global universe. Using the same framework as in Figure 3 and looking at the actual returns made by these strategies, we can see that quantitative and fundamental managers in most regions lie close to the 45 degree line, indicating that their benchmark-relative excess return is close to their idiosyncratic alpha calculated in our analysis. However, there are a couple of places where managers generated stronger excess returns versus their benchmark, but where part of this ‘alpha’ was due to Smart Beta tailwinds. European quantitative and fundamental managers, as well as US Small Cap quantitative managers, benefited from Smart Beta exposures.
Figure 4. Reported alpha versus regression intercept – quantitative and fundamental managers, all regions
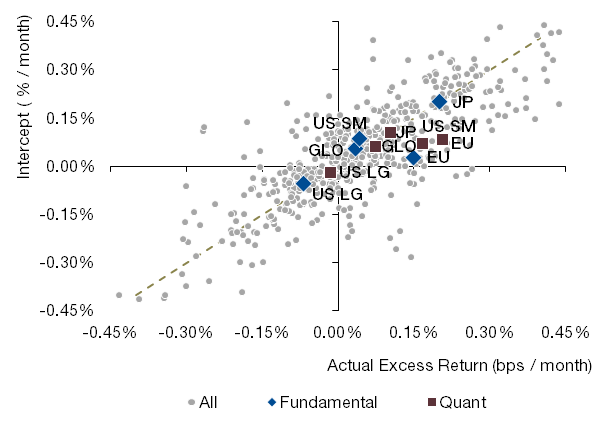
Source: eVestment and Man Numeric, 2017. For illustrative purposes only.
What do the measures of ‘activeness’ really tell us?
Asset owners and consultants often seek managers with higher active share or higher tracking error because these metrics are usually believed to reflect a manager’s confidence (presumably based on skill) in stepping away from their benchmark. Furthermore, asset owners and consultants are appropriately wary of paying active management fees for what may be viewed as index products in disguise. Lower turnover is often a sought after metric as well, primarily because it reduces explicit friction costs in the portfolio. Can we use the framework described in this paper to shed light on this issue?
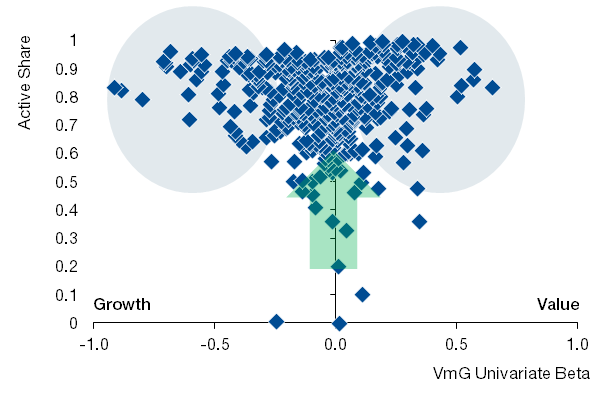
When seeking high active share, what is being sought is the manager’s skill in selecting specific stocks. Active share that results from Smart Beta bets are less attractive for two reasons: first, because they are contrary to isolating stock selection as a source of alpha, and second, they can be overlaid or purchased more cost effectively by the asset owner. The data reveals that active share among a sample of fundamental and quantitative managers is indeed connected to factor bets such as Value-minus-Growth, as shown in Figure 5.
Figure 5. Relationship between active share and Value-minus-Growth factor bets
Source: eVestment and Man Numeric, 2017. For illustrative purposes only.
While large factor bets are always associated with high active share, it is worth noting that large active share is not always associated with large factor bets. And here lies the utility of this framework: to tease out those managers who achieve high active share without taking large factor bets. Instead of wading through a list of all managers with high active share, one can use this framework to zoom in on those that have high active share and low factor bets – those near the y-axis in Figure 5. We use this framework in a similar way when looking at tracking error. When seeking managers with skill and confidence, one would rather select managers which derive the high tracking error from stock-level bets, rather than from factor bets. This framework can be used to narrow the search process to start from those high tracking-error managers that do not carry large factor bets. We can also use this framework to help identify managers whose investment philosophies may differ from expectations.
Do investors really get what they pay for? It’s a mixed picture
It is no secret that there has been fee compression in institutional asset management. Asset owners want the lowest fee possible, while managers are trying to maintain and justify their fees. Our framework is designed to make this analysis easier for both parties. However, the results will probably lead to disappointment to at least one. The manager may determine that they are undercharging for their high level of ‘pure alpha’, or an asset owner may realize that they are overpaying for an active manager who is relying heavily on factors that can be accessed more cheaply. To conduct this analysis, we used the stated weighted average fees from the eVestment universe for a USD 1billion mandate. We feel that this is appropriate given the discounting that often takes place on those stated fee schedules.
Those managers with higher levels of pure alpha and lower factor bets can legitimately command higher fees, in our view. However, the data reveals that the relationship is weak. Using our framework, our team analyzed the relationship between fees, idiosyncratic alpha, and Smart Beta exposure on the eVestment Global Large Cap Core universe. In general, investors might expect that the highest fees would be charged in strategies with the highest ‘pure alpha’, and lowest exposure to Smart Beta. However, in reality we find a more mixed picture: while some managers legitimately claim higher fees for their superior stock-selection skill, others seem to be commanding high fees with no (or even negative) skill beyond factor bets.
Conclusion
In the original Separating Alpha from Smart Beta paper, we proposed a framework for understanding the potential value added by active managers. We set out to determine how much of a manager’s return is due to generic, easily replicable factor bets and to isolate the manager’s pure alpha. Through this analysis we could also estimate the factor headwind or tailwind to the manager’s alpha to see those managers whose skill was masked by their unfortunate factor bets. Our extended research takes the original framework and expands it across geography and time, and is more granular in analyzing the differences between quantitative and fundamental approaches, investment strategies across global regions, and the metrics which help define ‘activeness’ in a portfolio. Our research reinforced some popularly held beliefs, for example that quantitative managers tend to have more exposure to Smart Beta factors. But it also challenges some views, such as the assumption that managers with higher active share and tracking error are always better. Overall, we believe that our research framework can also help determine whether investors are getting what they pay for in active management.
You are now leaving Man Group’s website
You are leaving Man Group’s website and entering a third-party website that is not controlled, maintained, or monitored by Man Group. Man Group is not responsible for the content or availability of the third-party website. By leaving Man Group’s website, you will be subject to the third-party website’s terms, policies and/or notices, including those related to privacy and security, as applicable.