1. Introduction
Portable alpha – or strategies designed to add alpha returns without risking the overall beta of the portfolio – are an important tool for investors. Finding alpha and constructing portfolios of hedge funds is no small challenge. Alpha can be unstable, especially in market downturns as historic correlations between traditional asset classes and hedge funds can rapidly break down. This breakdown may cause larger-than-anticipated losses, result in unexpected margin calls or even force potentially adverse trading decisions to defend portfolios from further losses.
This presents two detrimental scenarios for portable alpha strategies. First, given liquidity terms at hedge funds, distressed market trading decisions often come at the expense of the beta component through the sale of equity futures at potentially low levels. Second, an investor who may have anticipated this issue might have held excess cash, thereby limiting the opportunity set of the portable alpha strategy overall.
Through active risk controls and exposure management, we believe that investors can both improve outcomes during market drawdowns and thus gain valuable alpha returns in hedge fund portfolios, as well as avoid compromising their overall strategic beta allocation. Perhaps most importantly, they can focus on other opportunities in the market rather than the stress of margin calls.
2. Seeking Alpha
Alpha has proven increasingly elusive over the years, especially for investors allocating to active managers in the long-only space. Further, finding the combination of both beta (which is easy to acquire) and alpha in the same long-only investment creates a limited set of investment opportunities. In a portable alpha strategy, investors most typically make cash allocations to hedge funds and then use equity and bond futures to replicate their strategic allocation. By using futures, the investment portfolio stays true to its core allocations while freeing up cash to seek alpha through hedge fund investments (Figure 1).
Figure 1. A Portable Alpha Strategy Using Passive and Active Risk Management
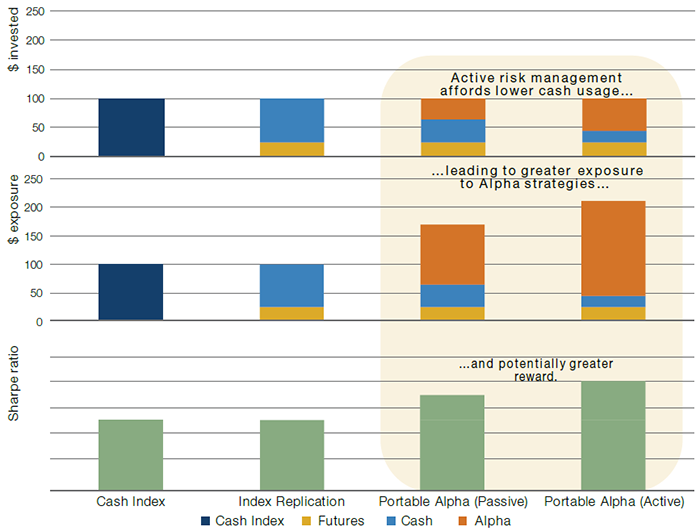
Source: Man Group database.
This separation of alpha from beta leaves investors free to find alpha across asset classes and a diverse array of hedge fund strategies. The investible universe ranges from multi-manager platforms to specialised equity long-short. Given these investments effectively create leverage, a set of criteria might include the following:
- Long-term stable track records;
- Low correlation to the beta portfolio;
- Low correlation to other selected funds and low expected losses in market dislocations.
The core goal is to ensure that the portfolio of hedge funds generates alpha in excess of what might be found in long-only funds, but also does not generate large drawdowns in market crises.
3. Risks
Embedded in portable alpha strategies are a number of risks to investors that can lead to unexpectedly poor returns:
- The portfolio of hedge funds may show higher correlations to one another and to equities on the downside;
- Risks may be exacerbated by illiquid markets, which most notably occur when markets fall, generating larger losses as hedge funds take down risk exposures;
- Potentially large drawdowns may occur in the equity futures in the beta component of the portable alpha strategy, which is held to replicate the strategic allocation of the original investment portfolio. While losses in the hedge fund portfolio are undesirable, given liquidity terms for most funds, investors will typically rarely be able to sell those allocations quickly enough to manage losses. In fact, the premise is that the portfolio remains stable, uncorrelated and generates alpha over time.
Where portfolios have the most liquidity is in the beta side of the strategy, which is generally implemented via highly liquid equity and bond futures. During market declines, these futures holdings can also cause potentially significant problems for investors. Typically, investors hold some cash buffers to meet margin calls on their futures portfolios. For those holding futures portfolios, the cash requirements are typically made up of cash required to initiate a futures position (initial margin) and cash needed to cover any losses on futures caused by price changes (variation margin). The buffer is intended to cover losses from market declines and changes in initial margin due to higher market volatility.
The Covid-19 selloff highlighted this problem. In March 2020, initial margin requirements required by exchanges doubled as daily price changes soared and exchanges became more conservative about leverage provided by futures.
Furthermore, declines in equity prices caused variation margin calls to cover losses. Figure 2 shows how margin requirements for a 60/40 portfolio1 of equity and bond futures evolved over the first quarter. We believe this represents a typical investor portfolio and is representative of the beta component of a portable alpha strategy.
Figure 2. Margin Requirement for a Passive ‘60/40’ Beta Portfolio Implemented Via Equity and Bond Futures
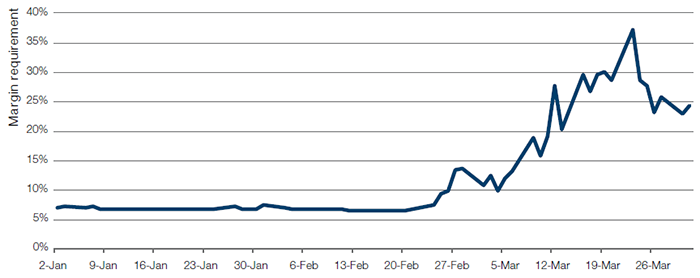
Source: Man Group; as of 31 March 2020.
In short, a portfolio which typically required 10% margin ballooned close to 40% over the course of a month; the apparently stable portfolio began drawing down cash very quickly.
For many investors, these margin calls came along with margin calls in other portfolio derivatives such as foreign exchange and liability hedges. As margin requirements must be settled immediately or face liquidation of futures holdings, investors not holding enough spare cash in their portable alpha strategy were left with only one option: to liquidate some or all of the futures exposures at low levels in equities.
4. How Might the Risk Profile of the Beta Component Be Improved?
As discussed above, a portable alpha strategy may incur losses on both the alpha and beta components during severe drawdowns, causing either the sale of the beta component, often at market bottoms, or the requirement of a large cash buffer to cover additional margin (illustrated in ‘Portable Alpha (Passive)’ in Figure 1).
We believe one solution is to have active management acting on liquid strategies, which can be within both alpha and beta components and take a variety of forms.
4.1. Controlling Drawdowns: Trend-Following
Trend-following strategies are perfect bed-fellows to long-only investments, in our view, whether viewed as standalone investments as part of the portable alpha strategy’s alpha component, or as an overlay within the beta component. Figure 3 demonstrates this schematically.
Figure 3. Comparative Expected Return Profiles of Trend-Following and Multi-Asset Long-Only Strategies
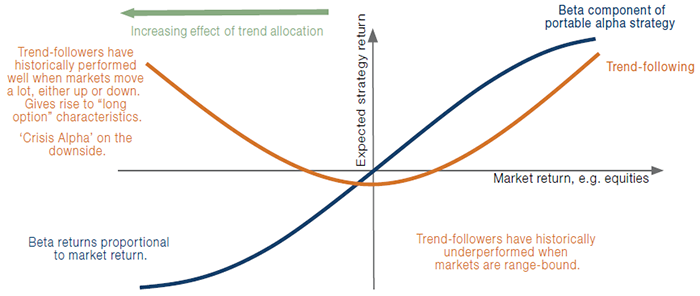
Schematic illustration. Please note that expectations are subject to the risk and that actual results may differ from those anticipated. Source: Man Group database.
Note how a trend-follower’s return profile appears to be highly convex; positive when asset prices significantly move in either direction. This is a well-known characteristic of trend-following strategies (see Greyserman & Kaminski, 2014) and occurs because large moves are generally associated with trending behaviour, either up or down. When market returns are negative, for example, trend-followers can potentially profit from falling markets. Of course there is no free lunch; trend-followers have historically lost money in directionless markets, which is why the stylised return profile is negative around zero.
4.2. Thinking in Terms of Risk: Volatility Scaling
The main reason that the margin requirement picks up in Figure 2 is that risk also rises. We substitute the beta component of a portable alpha strategy by a 60/40 portfolio. The term ‘60/40’ refers to an investment with 60% notionally in equities and 40% in bonds. This is in capital terms, with no leverage. 60/40 conjures up a sense of balance while, in fact, it is about 90% correlated to equities because it has both 50% higher allocation to equities over bonds and equities have historically been more volatile than bonds. If risk is proxied by volatility, the risk in 60/40 is effectively equity risk and rises as equity volatility rises.
Volatility scaling (perhaps better named ‘inverse’ volatility scaling) is a technique used by the alternatives industry for decades, which cuts positions proportionately to the increase in volatility in order to maintain a constant level of risk (all other things equal). Volatility-scaled strategies therefore do not run higher risk when markets fall and their margin requirements, as we shall see, are much smaller than those of notionally invested portfolios such as 60/40.
4.3. Catering for Changing Correlation Regimes
Changing portfolio correlation can be addressed through volatility-scaling techniques at the portfolio level. However, Figure 4 shows that negative bond-equity correlation since around 2000 is a rarity from a historical point of view and may very well revert to a more normal positive value. Particularly worrisome for a long-only multi-asset portfolio is a joint stock-bond selloff, which could happen when quantitative easing programmes are suddenly feared to be wound down (as was the case during the 2013 Taper Tantrum) or inflation surprises on the upside. Both scenarios we deem more likely to hit bond markets first and then spill over into equity markets.
Figure 4. Rolling 10-Year Bond-Equity Correlation
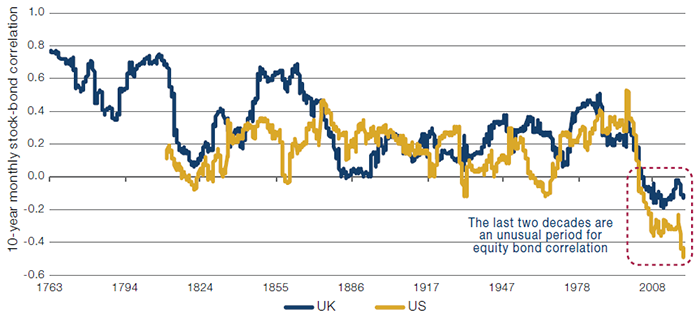
Source: UK data from Bank of England using monthly returns on UK equities and consolidated bonds. US data based on US 10-year Treasury notes and S&P Dow Jones equities returns, data range: Jan 1763 to September 2020 for UK correlations; Jan 1810 to September 2020 for US correlations. January 1810 is the earliest data available.
One way to deal with this issue is the so-called High-frEquency-bAsed VolatilitY (‘HEAVY’) model, which was put forth by academics at the Oxford-Man Institute of Quantitative Finance (see Shephard and Sheppard (2010) and Noureldin, Shephard, and Sheppard (2012)). We use an implementation of this model to help spot when a bond sell-off can potentially spill over into equities.
5. From Theory to Practice
Figure 5 illustrates the effects that these active risk management overlays can have on a portfolio of around 50 liquid bond and equity futures, and FX forward markets. As discussed, the 60/40 benchmark is chosen to represent the beta component of the portable alpha strategy, which has a long-term volatility of around 8%.
Figure 5. Active Risk Management of Beta Portfolio has Historically Mitigated Drawdowns
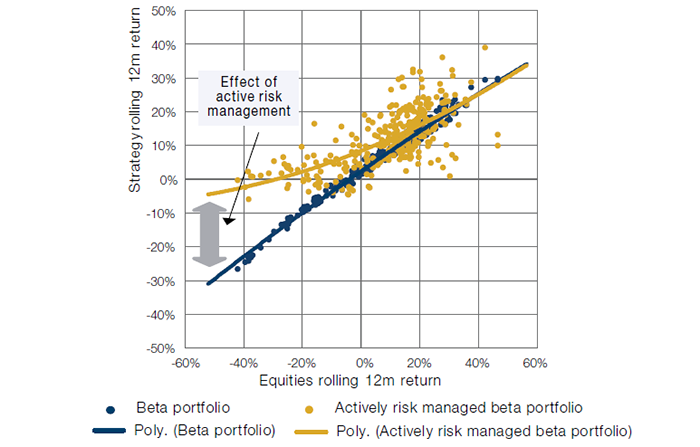
Simulated performance is not indicative of future results. Returns may increase or decrease as a result of currency fluctuations.
The performance, volatility and/or other information on the portfolios is simulated. The simulation has been created by ‘back testing’ a systematic trading model to historic data. Since the trades have not been executed, the published results may have under-or-over compensated for the impact, if any, of certain market factors, such as lack of liquidity. The synthetic track record is subject to change without notice as models develop over time. The performance results provided herein were based on simulations with trading costs estimated using internal slippage models. Portfolios are net of example fees of 1%, in order to better represent the fee and cost structure of an example fund. This approach has inherent limitations, including that results may not reflect the impact material economic and market factors might have had on the investment manager’s decision-making had the strategy been managed throughout the period over which the simulated performance is illustrated. Allocations are applied retrospectively over the period to provide an illustration of what the exposure of the portfolio would have been if that particular portfolio combination had existed. Calculations are available upon request.
‘Beta portfolio’ represented by a 60/40 portfolio based on 60% MSCI World Net Total Return and 40% Barclay Capital Global Aggregate Bond index rebalanced monthly. The composite is an appropriate benchmark for the strategy for performance comparison purposes.
Source: Man Group database, MSCI, Bloomberg; date range: 1 January 1995 to 31 August 2020.
The divergent best-fit quadratic polynomials during weak equity periods illustrate the effect of the active risk management, which acts to improve returns during weak performance, but without necessarily compromising returns on the upside.
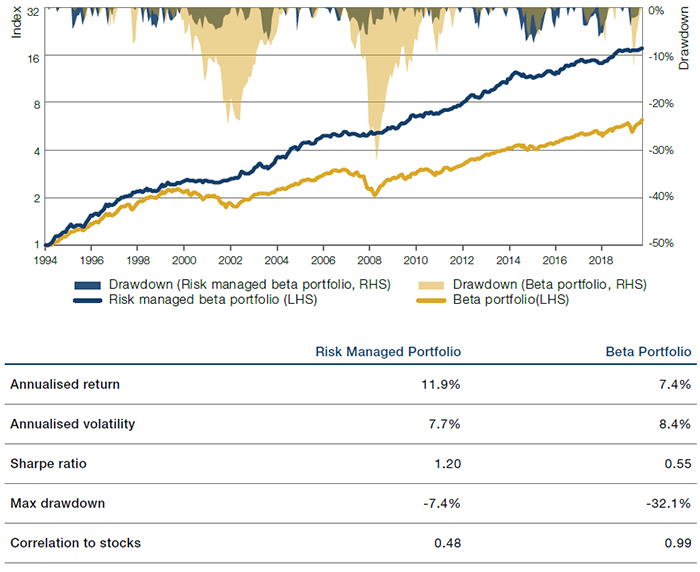
Figure 6 illustrates the same data in time-series terms, clearly showing the significant improvement in drawdown during the most significant market falls: 2000-2003, 2008 and the first quarter of 2020. The table of statistics also highlights this, as well as the improved return, Sharpe ratio and lower correlation to the benchmark, which, in this case, can be viewed as a proxy for the beta component of the portfolio.
Figure 6. Actively Risk-Managed Portfolio Exhibits Less Severe Drawdowns Than Beta Portfolio
Simulated performance is not indicative of future results. Returns may increase or decrease as a result of currency fluctuations.
The performance, volatility and/or other information on the portfolios is simulated. The simulation has been created by ‘back testing’ a systematic trading model to historic data. Since the trades have not been executed, the published results may have under-or-over compensated for the impact, if any, of certain market factors, such as lack of liquidity. The synthetic track record is subject to change without notice as models develop over time. The performance results provided herein were based on simulations with trading costs estimated using internal slippage models. Portfolios are net of example fees of 1%, in order to better represent the fee and cost structure of an example fund. This approach has inherent limitations, including that results may not reflect the impact material economic and market factors might have had on the investment manager’s decision-making had the strategy been managed throughout the period over which the simulated performance is illustrated. Allocations are applied retrospectively over the period to provide an illustration of what the exposure of the portfolio would have been if that particular portfolio combination had existed. Calculations are available upon request.
‘Beta portfolio’ represented by a 60/40 portfolio based on 60% MSCI World Net Total Return and 40% Barclay Capital Global Aggregate Bond index rebalanced monthly. The composite is an appropriate benchmark for the strategy for performance comparison purposes. World stocks are represented by MSCI World Net Total Return Index.
Source: Man Group database; date range: 1 January 1995 to 31 August 2020.
This active management benefits margin usage too. Figure 7 adds the margin requirement of this actively managed beta portfolio case we presented in Figure 2. In contrast to the notionally allocated static 60/40 beta portfolio, the active management has lower margin requirement as market volatility rises. This may potentially be of great use to the investor when margin demand, as highlighted above, can be high when volatility rises.
Figure 7. Comparing Margin Requirements
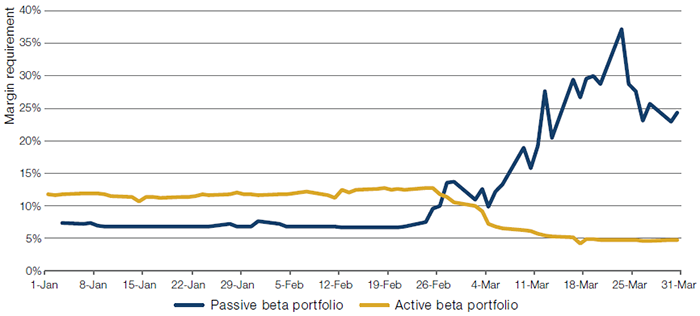
Source: Man Group database; date range 1 January 2020 to 31 March 2020. Margin requirements for an actively risk-managed beta portfolio are much lower in a drawdown than a passive beta portfolio, represented by 60/40.
6. Conclusion
Both the drawdown and margin usage of the beta component of portable alpha strategies can be improved through the use of active risk management techniques. As a result, an investor would be less likely to have to sell down their strategic allocation during periods of market turmoil when margin requirements increase. This can be a particularly significant effect if risk assets rebound as they did in 2020 after the Covid-19 related selloff.
Of course, freed of the concern of unforeseen margin calls, an investor may more efficiently allocate capital to alpha strategies within the portable alpha strategy. As the right-hand-side of Figure 1 illustrates, this can potentially unlock further portfolio returns.
Finally, as we showed in Figure 6, the same risk management techniques can be viewed as adding alpha, or uncorrelated return, either in the beta component or within the alpha strategies themselves.
1. The term ‘60/40’ refers to an investment with 60% notionally in equities and 40% in bonds. The calculation is based on a basket of equity futures meant to replicate their relative weights in the MSCI All World Index and bond futures consisting of 10- and 30-year bond futures in the US, Europe and Japan based on their relative weights in the Barclays Global Sovereign Index.
Bibliography
Greyserman, A. and K. Kaminski (2014), “Trend Following with Managed Futures: The Search for Crisis Alpha”. Wiley
Harvey, C. R., E. Hoyle, S. Rattray, M. Sargaison, D. Taylor, and O. Van Hemert (2019), “The Best of Strategies for the Worst of Times: Can Portfolios Be Crisis Proofed”. The Journal of Portfolio Management July 2019, 45 (5) 7-28; DOI: https://doi.org/10.3905/jpm.2019.45.5.007
Rattray, S., N. Granger, C. R. Harvey, and O. Van Hemert (2020), “Strategic Rebalancing”, The Journal of Portfolio Management Multi-Asset Special Issue 2020, jpm.2020.1.150; DOI: https://doi.org/10.3905/jpm.2020.1.150.
Hamill, C., S. Rattray, and O. Van Hemert, “Trend Following: Equity and Bond Crisis Alpha” (August 30, 2016). Available at SSRN: https://ssrn.com/abstract=2831926
Harvey, C. R., E. Hoyle, R. Korgaonkar, S. Rattray, M. Sargaison, and O. Van Hemert (2018), “The impact of volatility targeting”, Journal of Portfolio Management, 45(1), 14-33.
Noureldin, D., N. Shephard, K. Sheppard (2012), “Multivariate high-frequency-based volatility (HEAVY) models”, Journal of Applied Econometrics, 27(6), 907-933.
Shephard, N., K. Sheppard (2010), “Realising the future: forecasting with high-frequency-based (HEAVY) models”, Journal of Applied Econometrics, 25(2), 197-231.
Hypothetical Results
Hypothetical Results are calculated in hindsight, invariably show positive rates of return, and are subject to various modelling assumptions, statistical variances and interpretational differences. No representation is made as to the reasonableness or accuracy of the calculations or assumptions made or that all assumptions used in achieving the results have been utilized equally or appropriately, or that other assumptions should not have been used or would have been more accurate or representative. Changes in the assumptions would have a material impact on the Hypothetical Results and other statistical information based on the Hypothetical Results.
The Hypothetical Results have other inherent limitations, some of which are described below. They do not involve financial risk or reflect actual trading by an Investment Product, and therefore do not reflect the impact that economic and market factors, including concentration, lack of liquidity or market disruptions, regulatory (including tax) and other conditions then in existence may have on investment decisions for an Investment Product. In addition, the ability to withstand losses or to adhere to a particular trading program in spite of trading losses are material points which can also adversely affect actual trading results. Since trades have not actually been executed, Hypothetical Results may have under or over compensated for the impact, if any, of certain market factors. There are frequently sharp differences between the Hypothetical Results and the actual results of an Investment Product. No assurance can be given that market, economic or other factors may not cause the Investment Manager to make modifications to the strategies over time. There also may be a material difference between the amount of an Investment Product’s assets at any time and the amount of the assets assumed in the Hypothetical Results, which difference may have an impact on the management of an Investment Product. Hypothetical Results should not be relied on, and the results presented in no way reflect skill of the investment manager. A decision to invest in an Investment Product should not be based on the Hypothetical Results.
No representation is made that an Investment Product’s performance would have been the same as the Hypothetical Results had an Investment Product been in existence during such time or that such investment strategy will be maintained substantially the same in the future; the Investment Manager may choose to implement changes to the strategies, make different investments or have an Investment Product invest in other investments not reflected in the Hypothetical Results or vice versa. To the extent there are any material differences between the Investment Manager’s management of an Investment Product and the investment strategy as reflected in the Hypothetical Results, the Hypothetical Results will no longer be as representative and their illustration value will decrease substantially. No representation is made that an Investment Product will or is likely to achieve its objectives or results comparable to those shown, including the Hypothetical Results, or will make any profit or will be able to avoid incurring substantial losses. Past performance is not indicative of future results and simulated results in no way reflect upon the manger’s skill or ability.
You are now leaving Man Group’s website
You are leaving Man Group’s website and entering a third-party website that is not controlled, maintained, or monitored by Man Group. Man Group is not responsible for the content or availability of the third-party website. By leaving Man Group’s website, you will be subject to the third-party website’s terms, policies and/or notices, including those related to privacy and security, as applicable.