Introduction
Active management is a difficult business: not only is it hard to consistently generate persistent excess returns at scale, but it is also hard to unpick skill from luck. For allocators and recruiters, the tendency is to focus on outcomes – who hasn’t been guilty of extrapolating a track record at some point?
But in a pursuit beset with so much noise, so many styles, and frankly the capacity for luck to contribute to perceptions of brilliance over an entire business cycle, focusing on outcomes is fraught with danger. In The Success Equation, Michael Mauboussin explains how powerful the narrative fallacy is in our reasoning: “The basic challenge is that we love stories and have a yearning to understand the relationship between cause and effect. As a result, statistical reasoning is hard, and we start to view the past as something that is inevitable.”
At Man GLG, we have two overriding principles in hiring and supervising portfolio managers: 1) we have no house view; and 2) we try to judge skill from processes, rather than fixate on outcomes.
Consider the spectacular, rapid asset gathering successes of some growth-orientated firms in the past two years through this lens: rates collapsed, long duration equities soared, and firms with all-encompassing house views that embraced this style were lauded as rare geniuses. But since the conditions that led to the furious rally in duration were inherently unforecastable, it is difficult to conclude that performance outcomes reflect skill.
At Man GLG, we have two overriding principles in hiring and supervising portfolio managers: 1) we have no house view – portfolio managers are free to execute their strategies as they see fit within pre-agreed risk limits; and 2) we try to judge skill from processes, rather than fixate on outcomes. We do the former because we are acutely aware that styles come and go, that the best managers design processes that are consistent with their personality types, and that what works for one does not work for another. We do the latter because, frankly, it gives us an edge in hiring, producing returns, and satisfying the itch of those keenest to improve. We hope that contributes to this being an excellent place to work, and so in retaining top talent.
The purpose of this article is to shed some light on the efforts a discretionary firm can take to measure skill, how similar performance outcomes can result from remarkably different processes and inputs, and how this skill research can lead portfolio managers to embrace subtle changes to enhance their returns.
Why Measure Skill?
A primary goal of measuring skill is to provide hard, quantitative feedback to portfolio managers to help them understand what works for them, and develop and hone their investment process.
Let us make an unnatural comparison here and take archery as an example. Once a bowman shoots his arrow at his target, the ‘feedback’ he gets is almost instantaneous: he knows whether he’s close to the target or not. This can allow the archer to change his position, tilt the bow, aim higher or lower, etc, to get to the desired result.
Unfortunately, feedback from financial markets often come in a highly distorted and untimely manner. Once a manager initiates a position, she doesn’t instantaneously know whether it was a good or bad decision – factors such as market movements, ‘noise’ from competitors and behavioural and unconscious biases all muddy the feedback.
This can potentially reinforce long-term suboptimal behaviours. As such, we believe it’s important that portfolio managers are provided with effective data-supported feedback to counteract anecdotal evidence that can be given too much credence by either its recency or emotional intensity.
Hit Rates and Payoff Ratios
A manager’s ‘hit rate’ and ‘payoff ratio’ are two metrics that can help explain how a manager delivers returns.
- Hit rate: the percentage of manager’s ideas that make money;
- Payoff ratio: the average gain against the average loss and a gauge of the asymmetry of the outcomes.
Typically, a manager will look for opportunities where the upside is far greater than the downside, which results in a payoff ratio greater than one. These two metrics can be viewed as traits of a manager rather than targets that a manager is directly trying to aim for, though changes in the metrics over time can be useful diagnostics for detecting behavioural changes.
Figure 1 shows how a portfolio’s overall return is related to the hit rate and payoff ratio – all other things being equal (such as trading frequency and position sizing). A 50% hit rate and a payoff ratio of 1 (which implies that a manager that gets half of their ideas right and they lose the same amount on their losing ideas as they make on their winners, highlighted by the dashed lines) lies on the breakeven contour line. Many strategies with the same P&L outcome lie on this breakeven line – we can move down the curve and to the right, which increases the hit rate at the expense of the payoff ratio, and vice versa by moving up and left.
Figure 1. How Portfolio Return Is Related to Hit Rate and Payoff Ratio
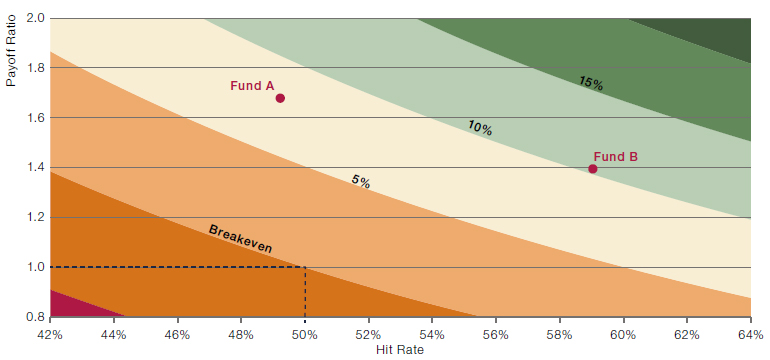
Source: Man GLG. For illustrative purposes only.
There is a clear positive correlation between return and payoff: in other words, it matters less that a portfolio manager is right or wrong, rather that they know when they are right and wrong, and in both cases act with conviction by running winners and cutting losers.
Hit rate is widely understood, and it is common to assume that the more skilled the investor, the higher the hit rate. Empirically, however, our analysis reveals a weaker relationship between hit rate and performance than shown in Figure 1. In fact, there is a clear positive correlation between return and payoff: in other words, it matters less that a portfolio manager is right or wrong, rather that they know when they are right and wrong, and in both cases act with conviction by running winners and cutting losers. This is the statistical embodiment of the notion that success in an environment of noise and uncertainty requires the courage to act on imperfect information, and the humility to doubt what you know – in other words, “strong opinions, weakly held.”
Figure 1 above provides an interesting insight into how different processes and philosophical approaches can arrive at comparable outcomes. Take two hypothetical equity hedge funds which excel in their chosen niches (Fund A and Fund B in Figure 1). Assume that these funds have arrived at similar outcomes in terms of annualised returns, and almost identical outcomes in terms of Sharpe ratios since inception, at c.1.6x net of fees. Fund A actually has a hit rate marginally below 50% – this is a team that pays particular attention to managing downside volatility, such that losers are cut very quickly. While there may be an opportunity cost in some instances in cutting a stock that has not performed, the indisputable benefit is that the payoff ratio is very high. Fund B, on the other hand, has an exceptional hit rate at almost 60%. To achieve this, the manager has to have a high degree of conviction in their team’s analysis, and the capacity to tune out noise that challenges that conviction. Again, there is a cost to this approach – the scope to incur greater losses on losers than for Fund A. But for this fund, the combination of exceptional hit rate with good payoff, leads to a very positive outcome.
Measuring Skill
Good portfolio managers embrace philosophies that are consistent with their cognitive and behavioural processes, and these may differ materially from one highly skilled team to another.
The metrics mentioned above can help to detect traits for a manager. In both cases, it is useful to marry the managers’ statistical traits to behavioural attributes and their characters. As we said at the outset, at Man GLG, we have no house view – portfolio managers are free to execute their strategies as they see fit within pre-agreed risk limits – and we have no bias that there is any one way that constitutes the ‘right’ way to manage portfolios. Good portfolio managers embrace philosophies that are consistent with their cognitive and behavioural processes, and these may differ materially from one highly skilled team to another.
There are four main ways to customise these skill metrics:
- Choose an appropriate benchmark
Typically, about 30-50% of a stock position’s return is explained by movements in the market. Being able to isolate a position’s return due to skill as opposed to due to market movements is therefore key. As such, it is important to choose an appropriate benchmark so that the longs and shorts can be examined, without market movements overwhelming the analysis. Otherwise, all the longs would look great in a bull market, while all the shorts would look terrible. Depending on the manager, it may make sense to go further to neutralise industries, countries and other common factors to isolate skill in identifying firm idiosyncratic returns.
- Understand the investment process
Next, to understand the core investment process, the average holding period and what constitutes a meaningfully sized position for each portfolio manager should be considered. It may also be worth sub-selecting the measures that are aligned with the manager’s intentions; for example, if trading earnings announcements are a core part of investment process, then those measures should be brought to the fore.
- Assess investment activity
Though it may sound obvious, we believe a manager’s two primary activities – initiating or increasing positions, as well as closing or decreasing positions – should be measured.
Although these activities – buying and shorting – seem like two sides of the same coin, there are usually quite distinct behaviours and skill levels between the two, primarily driven by the differing levels of attention and purpose behind the trading. For instance, shorting stocks tend to be riskier than longs for a variety of reasons: first, market movements such as M&A activity or, as we saw in January 2021, retail trading can make stocks surge higher; second, markets tend to go up longer than they tend to fall. As such, shorting requires a different skillset – indeed, almost even a different mindset – from portfolio managers.
Another reason to assess investment activity is to measure the alpha decay: because of biases, portfolio managers may stay in a ‘long’ position or keep holding onto their shorts for too long.
Putting the building blocks of buys and sells together, one can look at trading ‘episodes’ where the life cycle of an idea is examined, from entering into – and scaling – a stock position, to exit. In this way, the timing and sizing skill, and how the alpha decay is managed, can be measured.
- Compare with counterfactuals
To make the insights stronger and more concrete, and to enable recommendations being made to portfolio managers, we believe it is important to present counterfactuals, where simple transformations to a portfolio such as a stop loss rule or equal sizing positions are mechanically applied.
For example, consider a portfolio manager who holds onto his losing short positions for too long. In this case, the counterfactual portfolio could implement a mechanical stop loss of, say, 10% for each losing short positions. Then a comparison would be made between the real portfolio and the counterfactual portfolio to compare how much of the loss could have been mitigated if the stop loss was in place.
Comparing the counterfactual portfolios to the actual portfolios helps the manager understand, for example, how much value their sizing decisions have contributed and how consistent that value has been through time.
Share the Findings, Recommendations and Feedback
Once the metrics have been assembled, the next critical step is presenting the data back to the managers.
When holding up the quantitative mirror to a portfolio manager, a good proportion of the insights shouldn’t really be a surprise; after all, part of being a successful manager is being very self-aware. These confirmatory insights help the manager build confidence in their process while other revelatory aspects can become lively topics of discussion, which is likely to trigger a bespoke piece of research.
For elite competition, where success or failure often comes down to the barest of margins, focusing on incremental improvements makes an enormous amount of sense.
For elite competition, where success or failure often comes down to the barest of margins, focusing on incremental improvements makes an enormous amount of sense: taking each part of a process and doing things a little better can compound up to make material differences in outcomes.
The investment in understanding skill ultimately underpins the belief that by better understanding the behavioural contributors to performance, portfolio managers can be nudged into small process enhancements that will positively impact performance. Overwhelmingly, we have found that these enquiries come from the managers themselves as they consume the information in their skill reports.
Below, we present two case studies where process enhancements can generate a marginal gain. It is also the case that for an inquisitive, skilful manager who committed to improvement, the process of researching and discussing these findings is enormously powerful in influencing behaviour and improving daily processes.
Case Study 1: Trade Motivation
Assume a team wanted to understand how its hit rates and payoffs differed according to trade motivation – are they better at reinforcing a winner or a loser, or do they trade better on concrete information versus as a reaction to price movements or position P&L?
The trading criteria can be summarised in the following way to capture the emotional backdrop for each decision and the corporate catalyst:
- Making money;
- Losing money;
- News;
- No news.
Each increase or decrease in a position can be categorised on these bases. Figure 2 shows the payoff, hit rate and P&L attribution of these trade decisions.
Figure 2. Payoff, Hit Rate and P&L Attribution of Trade Decisions
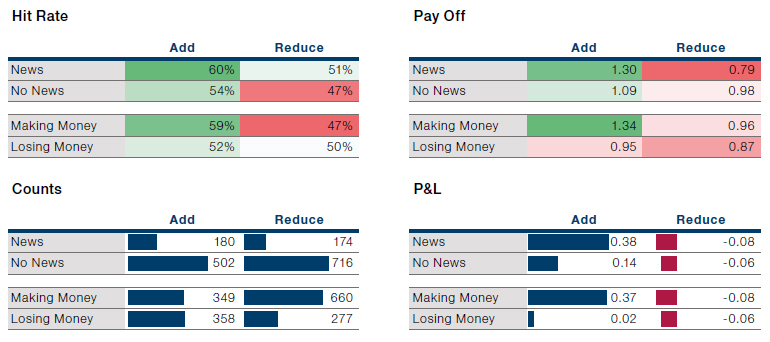
Source: Man GLG. For illustrative purposes only.
Results determined by the MSCI Europe Investable Market Index between 2015 and 2021.
Hit rates and payoffs are materially better following news than in the absence of news. While the course of normal portfolio management will require the team to act outside of the news cycle, this is an important finding that empirically underpins the benefits of acting on new information rather than in reaction to price, volatility or market backdrop.
This analysis also shows that the team does well when reinforcing winning positions (hit rate and payoff on adds when making money), though much less well (in payoff terms) when adding to losing positions. The clear inference from this is that the hurdle for action should, perhaps, be higher when a position is not working.
Case Study 2: Mechanical Stop Loss Rules
Assume a portfolio manager has worked hard to convert a high hit rate (56%) into an improvement in Sharpe ratio and the preference is to implement stop-losses at position level to short-circuit the cognitive biases that lead to running losers – i.e., sacrificing the hit rate for a higher pay out.
The breakdown of hit rate and payoff by long and short position could prove to be a particularly interesting starting point for further work. While we certainly believe there is value in tightening up weaker areas in the investment process, bigger gains can often be made by building on strengths.
To do this, various stop-loss levels can be tested to calibrate the appropriate level. The time series in Figure 3 shows the cumulative P&L impact from using systematic stop-losses, with 50 basis points proving to be the most effective, adding almost around 450bps cumulatively to performance, or 90bps annually. The plot in the bottom right shows the payoff increasing as the hit rate declines when the trigger point on the stoploss are tightened. The tight stop-loss rule at 25bps can be rejected on the basis that the primary driver of Sharpe increase is reduction in portfolio volatility from stopping out too many names.
Problems loading this infographic? - Please click here
Source: Man GLG. For illustrative purposes only.
Results determined by the MSCI Europe Investable Market Index between 2015 and 2021.
Note: Hypothetical results are calculated in hindsight, invariably show positive rates of return, and are subject to various modeling assumptions, statistical variances and interpretational differences. No representation is made as to the reasonableness or accuracy of the calculations. Since trades have not actually been executed, Hypothetical Results may have under- or overcompensated for the impact, if any, of certain market factors.
Conclusion
Imagine a monkey, a penguin, an elephant, and a fish in a bowl standing before an adjudicator. The judge then declares, “To ensure a fair process, you shall all take the same exam. Please climb that tree.” It is foolish to judge everybody by the same set of metrics, especially taking into consideration individual strengths and weaknesses. After all, there’s no point in measuring a fish’s ability to climb a tree!
Similarly, managers are diverse in their skills. To cater to this diversity, considerable care needs to be taken to customise the skill metrics to each manager to ensure that each individual portfolio manager can embrace subtle changes to enhance their returns.
Hypothetical Results
Hypothetical Results are calculated in hindsight, invariably show positive rates of return, and are subject to various modelling assumptions, statistical variances and interpretational differences. No representation is made as to the reasonableness or accuracy of the calculations or assumptions made or that all assumptions used in achieving the results have been utilized equally or appropriately, or that other assumptions should not have been used or would have been more accurate or representative. Changes in the assumptions would have a material impact on the Hypothetical Results and other statistical information based on the Hypothetical Results.
The Hypothetical Results have other inherent limitations, some of which are described below. They do not involve financial risk or reflect actual trading by an Investment Product, and therefore do not reflect the impact that economic and market factors, including concentration, lack of liquidity or market disruptions, regulatory (including tax) and other conditions then in existence may have on investment decisions for an Investment Product. In addition, the ability to withstand losses or to adhere to a particular trading program in spite of trading losses are material points which can also adversely affect actual trading results. Since trades have not actually been executed, Hypothetical Results may have under or over compensated for the impact, if any, of certain market factors. There are frequently sharp differences between the Hypothetical Results and the actual results of an Investment Product. No assurance can be given that market, economic or other factors may not cause the Investment Manager to make modifications to the strategies over time. There also may be a material difference between the amount of an Investment Product’s assets at any time and the amount of the assets assumed in the Hypothetical Results, which difference may have an impact on the management of an Investment Product. Hypothetical Results should not be relied on, and the results presented in no way reflect skill of the investment manager. A decision to invest in an Investment Product should not be based on the Hypothetical Results.
No representation is made that an Investment Product’s performance would have been the same as the Hypothetical Results had an Investment Product been in existence during such time or that such investment strategy will be maintained substantially the same in the future; the Investment Manager may choose to implement changes to the strategies, make different investments or have an Investment Product invest in other investments not reflected in the Hypothetical Results or vice versa. To the extent there are any material differences between the Investment Manager’s management of an Investment Product and the investment strategy as reflected in the Hypothetical Results, the Hypothetical Results will no longer be as representative, and their illustration value will decrease substantially. No representation is made that an Investment Product will or is likely to achieve its objectives or results comparable to those shown, including the Hypothetical Results, or will make any profit or will be able to avoid incurring substantial losses. Past performance is not indicative of future results and simulated results in no way reflect upon the manager’s skill or ability.
You are now leaving Man Group’s website
You are leaving Man Group’s website and entering a third-party website that is not controlled, maintained, or monitored by Man Group. Man Group is not responsible for the content or availability of the third-party website. By leaving Man Group’s website, you will be subject to the third-party website’s terms, policies and/or notices, including those related to privacy and security, as applicable.