ARTICLE | 4 MIN | VIEWS FROM THE FLOOR

Liquidity: The Dominant Driver of Prices

December 5, 2023

As liquidity diminishes, markets will once again be able to price risk more accurately, though there may be selloffs first.

In 2023 it has been liquidity dynamics, rather than fundamentals, that have arguably driven financial assets. Any narrative around what is driving prices has been formed by market participants rationalising price moves after the fact. When yields have been soft, consensus has been for a soft landing. When less supportive, markets’ focus has shifted to disappointments in inflation, activity and labour market readings. Underlying these factors, however, is the overwhelming amount of liquidity – both in terms of flows and stock – that has been the actual driver of price moves. What happens when this liquidity support starts to reduce? At that point, it’s likely that markets will be able to price risks more accurately once more.

Figure 1 shows that when the Treasury cash balance deposited at the Federal Reserve (Fed) decreases (inverted in the chart), this supports risk assets, using the S&P 500 Index here as a proxy. This drop happens especially when the government reaches the debt ceiling and cannot inject the organic increase in duration typically observed during normal times. When the debt ceiling limits are rolled over, Treasury issuance accelerates and the duration injection increases.

Rinse and repeat…

Digging into recent data, over 2021, the combination of a Treasury liquidity boost (approximately $1.6 trillion between early January and late December) and growth in the Fed’s balance sheet (roughly another $1.6 trillion) buoyed risk assets. However, when the debt ceiling was rolled over in early 2022 and the Treasury replenished its cash account at the Fed, quantitative easing made way for tightening, leading to selloffs. This cycle repeated between October 2022 and June 2023, coinciding with fluctuations in the Treasury cash account and the subsequent selloff after the debt ceiling rollover.

Figure 1: Relationship between the US Treasury general account (inverted), the Fed’s balance sheet and S&P 500 performance

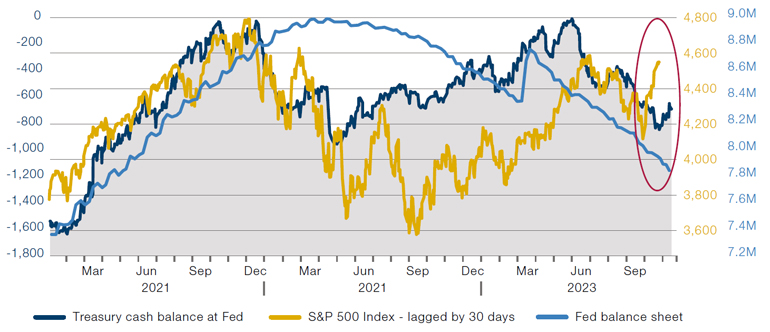
Source: Bloomberg, as of November 24 2023.

Until the correlation breaks down

As indicated by the red oval in Figure 1, this correlation seems to have recently broken down. Market consensus is that the data released in recent weeks suggests a soft landing is nearly certain, justifying the near-record highs in equities and tight spreads, as well as Treasury yields falling by some 50 basis points in the middle and longer ends of the curve.1 Around 90 bps of rate cuts are now priced in over the next year, with the first one likely by May 2024. The rationale? The Fed will need to cut rates as inflation converges to the 2% target to prevent a significant increase in real rates and thus monetary tightening.

Another argument is that the US economy will experience a recession driven by a reduction in fiscal stimulus, with the private sector unable to step in to take up the slack. However, were this the case, we would expect to see yields and equities both down, rather than yields down and equities up.

Can the rally last? High-frequency trading may hold the answer

A simpler, although unproven, hypothesis to explain the rally in equities and bonds since 22 October is that the activity of high-frequency trading strategies (CTAs, algorithms etc.), which now account for a significant portion of daily volume, overwhelms the actions of longer-term investors focused on fundamentals.

The sharp increase in Treasury yields around 23 October was a consequence of the liquidity withdrawal resulting from the debt ceiling rollover in early June and the Treasury’s announcement in August of increased note and bond issuance that began in September. As we approached the October peak, several FOMC members said that the steepening yield curve was tightening financial conditions, which could reduce the need for further hikes. Following this, on 1 November, the US Treasury announced a reduction (albeit small) in the future issuance of Treasuries relative to market expectations. This triggered significant acceleration in the decline in yields which, combined with the idea that an expectation of increased labour participation could temporarily boost economic growth potential beyond long-term levels. If this holds, the Fed may take the risk of not hiking further.

Between 1 November and 21 November, inflation, labour and activity releases indeed supported this idea of disinflation. However, initial claims data, Michigan sentiment, and inflation expectations released during Thanksgiving week are the first data points that challenge this view. Based on analysis of CTA returns, most short rate positions have been unwound, equity exposure has been added, and credit exposure remains high, arguably setting the stage for another upward move in yields. And if yields do start rising again, a near-term reversal of the recent rally in risk assets seems likely.

With contributions from Guillermo Ossés, Head of Emerging Market Debt Strategies, Man GLG.

1. Source: Bloomberg.

For further clarification on the terms which appear here, please visit our Glossary page.

This information is communicated and/or distributed by the relevant Man entity identified below (collectively the "Company") subject to the following conditions and restriction in their respective jurisdictions.

Opinions expressed are those of the author and may not be shared by all personnel of Man Group plc (‘Man’). These opinions are subject to change without notice, are for information purposes only and do not constitute an offer or invitation to make an investment in any financial instrument or in any product to which the Company and/or its affiliates provides investment advisory or any other financial services. Any organisations, financial instrument or products described in this material are mentioned for reference purposes only which should not be considered a recommendation for their purchase or sale. Neither the Company nor the authors shall be liable to any person for any action taken on the basis of the information provided. Some statements contained in this material concerning goals, strategies, outlook or other non-historical matters may be forward-looking statements and are based on current indicators and expectations. These forward-looking statements speak only as of the date on which they are made, and the Company undertakes no obligation to update or revise any forward-looking statements. These forward-looking statements are subject to risks and uncertainties that may cause actual results to differ materially from those contained in the statements. The Company and/or its affiliates may or may not have a position in any financial instrument mentioned and may or may not be actively trading in any such securities. Unless stated otherwise all information is provided by the Company. Past performance is not indicative of future results.

Unless stated otherwise this information is communicated by the relevant entity listed below.

Australia: To the extent this material is distributed in Australia it is communicated by Man Investments Australia Limited ABN 47 002 747 480 AFSL 240581, which is regulated by the Australian Securities & Investments Commission ('ASIC'). This information has been prepared without taking into account anyone’s objectives, financial situation or needs.

Austria/Germany/Liechtenstein: To the extent this material is distributed in Austria, Germany and/or Liechtenstein it is communicated by Man (Europe) AG, which is authorised and regulated by the Liechtenstein Financial Market Authority (FMA). Man (Europe) AG is registered in the Principality of Liechtenstein no. FL-0002.420.371-2. Man (Europe) AG is an associated participant in the investor compensation scheme, which is operated by the Deposit Guarantee and Investor Compensation Foundation PCC (FL-0002.039.614-1) and corresponds with EU law. Further information is available on the Foundation's website under www.eas-liechtenstein.li.

European Economic Area: Unless indicated otherwise this material is communicated in the European Economic Area by Man Asset Management (Ireland) Limited (‘MAMIL’) which is registered in Ireland under company number 250493 and has its registered office at 70 Sir John Rogerson's Quay, Grand Canal Dock, Dublin 2, Ireland. MAMIL is authorised and regulated by the Central Bank of Ireland under number C22513.

Hong Kong SAR: To the extent this material is distributed in Hong Kong SAR, this material is communicated by Man Investments (Hong Kong) Limited and has not been reviewed by the Securities and Futures Commission in Hong Kong.

Japan: To the extent this material is distributed in Japan it is communicated by Man Group Japan Limited, Financial Instruments Business Operator, Director of Kanto Local Finance Bureau (Financial instruments firms) No. 624 for the purpose of providing information on investment strategies, investment services, etc. provided by Man Group, and is not a disclosure document based on laws and regulations. This material can only be communicated only to professional investors (i.e. specific investors or institutional investors as defined under Financial Instruments Exchange Law) who may have sufficient knowledge and experience of related risks.

Switzerland: To the extent this material is made available in Switzerland the communicating entity is:

  • For Clients (as such term is defined in the Swiss Financial Services Act): Man Investments (CH) AG, Huobstrasse 3, 8808 Pfäffikon SZ, Switzerland. Man Investment (CH) AG is regulated by the Swiss Financial Market Supervisory Authority (‘FINMA’); and
  • For Financial Service Providers (as defined in Art. 3 d. of FINSA, which are not Clients): Man Investments AG, Huobstrasse 3, 8808 Pfäffikon SZ, Switzerland, which is regulated by FINMA.

United Kingdom: Unless indicated otherwise this material is communicated in the United Kingdom by Man Solutions Limited ('MSL') which is a private limited company registered in England and Wales under number 3385362. MSL is authorised and regulated by the UK Financial Conduct Authority (the 'FCA') under number 185637 and has its registered office at Riverbank House, 2 Swan Lane, London, EC4R 3AD, United Kingdom.

United States: To the extent this material is distributed in the United States, it is communicated and distributed by Man Investments, Inc. (‘Man Investments’). Man Investments is registered as a broker-dealer with the SEC and is a member of the Financial Industry Regulatory Authority (‘FINRA’). Man Investments is also a member of the Securities Investor Protection Corporation (‘SIPC’). Man Investments is a wholly owned subsidiary of Man Group plc. The registration and memberships described above in no way imply a certain level of skill or expertise or that the SEC, FINRA or the SIPC have endorsed Man Investments. Man Investments Inc, 1345 Avenue of the Americas, 21st Floor, New York, NY 10105.

This material is proprietary information and may not be reproduced or otherwise disseminated in whole or in part without prior written consent. Any data services and information available from public sources used in the creation of this material are believed to be reliable. However accuracy is not warranted or guaranteed. © Man 2025