The End of the Inflation Undershoot?
Ten years ago, on 25 January 2012, the Federal Reserve introduced a 2% inflation target. This was amended to an average inflation targeting framework a few years ago, allowing for overshoots (and undershoots) in the 2% annual rate.
So where are we with the target 10 years on?
Using 2012 as the base year, Figure 1 compares the 2% target (yellow line), the personal consumption expenditure (‘PCE’) deflator index (dark blue line) and the shortfall versus the target (light blue line). At its worst point in March 2020, the shortfall versus the target was a cumulative 5.8%. However, after PCE inflation averaged 5.4% in 2021, the undershoot gap has fallen to just 2%. If PCE inflation averages 6% in the first half of 2022, the index will have fully caught up by June. Inflation undershoot will be over.
What does this mean for policy? In the very short term, nothing much. Under its Flexible Average Inflation Targeting policy, the Fed can overshoot just as much as they undershot historically, allowing inflation to run hot and avoiding tightening while focusing on the unemployment rate. The December 2022 Fed Funds contract is pricing 91 basis points, compared with the current rate of 8 bps. This would imply that the market expects three 25bps hikes in 2022, with a 30% chance of a fourth before year end. While this is similar to the expectations of the Fed’s Dot Plot, it is a marked change in the mood music: at the end of September 2021, only 25bps of hikes were priced in.
In our view, this may turn out to be optimistic. An average PCE inflation of 6% will increase the cost of living substantially in a short period of time, emphasising something that is already a big concern for US voters. With mid-term elections approaching in November, there could well be rising political pressure to tame inflation – and therefore strong pressure for the Fed to hike further than currently anticipated.
Figure 1. Inflation Undershoot: 2012-2021
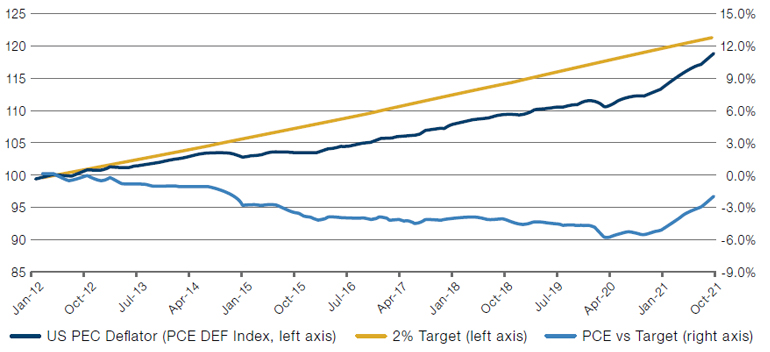
Source: Man Solutions, Federal Reserve; as of November 2021.
A Good Value Year!
After the better part of a lost decade, 2021 has finally been Value’s year. The outperformance of the cheapest quintile of global stocks over the most expensive was almost 25%, with the global reflation trade in the first quarter and an inflationary fourth quarter being the most profitable periods for the factor (Figure 2).
However, the stage may well be set for an even stronger 2022. Figure 3 shows the performance of equity factors compared with the returns to 10-year US Treasuries. As illustrated, factors associated with Value, such as Book-to-Price, Earnings Yield and Dividend Yield all perform badly when US Treasuries do well – and vice versa.
US 10-year yields have risen sharply in 2022, by around 20bps year-to-date. Given that prices fall when yields rise, it could well be possible that Value continues its outperformance in 2022: history suggests the factor outperforms in a rising yield environment, supported by the intuition that longer-duration Growth stocks will be hurt by rising yields.
Figure 2. Value, Quality and Momentum Performance, 2021
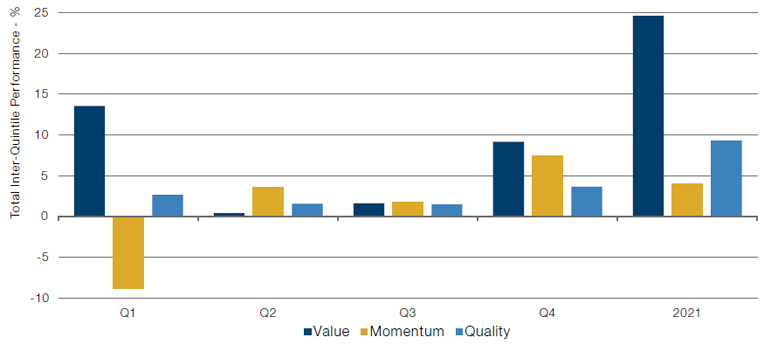
Source: Man Numeric, Bloomberg; as of 1 January 2022.
Performance represented by Barra factor performance. For more information please click here: https://www.msci.com/eqb/methodology/meth_docs/MSCI_Barra_Factor_Indexes_Methodology_June2017.pdf
Figure 3. Rolling 36-Month Slope of Factor Returns to US 10-Year Treasury Returns
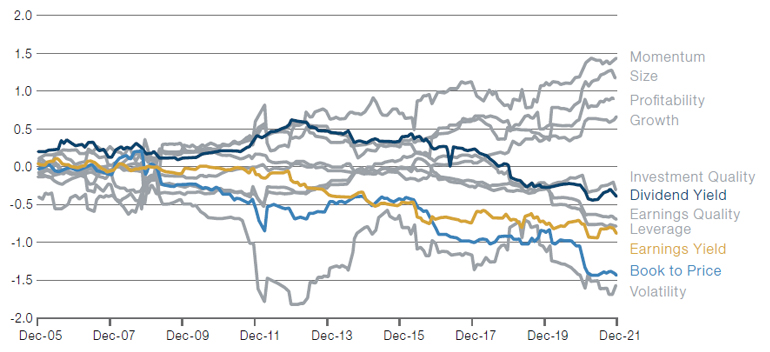
Source: Man Numeric, Bloomberg; as of 11 January 2022.
Performance represented by Barra factor performance. For more information please click here: https://www.msci.com/eqb/methodology/meth_docs/MSCI_Barra_Factor_Indexes_Methodology_June2017.pdf
With contributions from: Ben Funnell (Portfolio Manager, Man Solutions) Teun Draaisma (Portfolio Manager, Man Solutions), Henry Neville (Analyst, Man Solutions) and Jayendran Rajamony (Head of Alternatives, Man Numeric).
You are now leaving Man Group’s website
You are leaving Man Group’s website and entering a third-party website that is not controlled, maintained, or monitored by Man Group. Man Group is not responsible for the content or availability of the third-party website. By leaving Man Group’s website, you will be subject to the third-party website’s terms, policies and/or notices, including those related to privacy and security, as applicable.