Key takeaways:
- Despite unprecedented AI-related capital expenditure, productivity gains remain elusive. Such gains can't come soon enough, given the experience of recent decades. Apple illustrates this challenge: our estimates show research productivity declining almost 40% annually from 2005-2024 despite a ninefold increase in research and development (R&D) resources. Our broader analysis of 1,218 US firms from 1975 to 2024 reveals median research productivity declining 10% annually even as R&D investment grows 6% per year
- AI could potentially address this by augmenting human researchers or functioning as autonomous 'digital researchers' that scale beyond demographic constraints
- Historical precedent suggests patience will be required, with previous general-purpose technologies taking 20-40 years to show productivity impacts at the aggregate level. Rather than waiting for economy-wide productivity statistics, investors should monitor firm-level indicators in R&D intensive sectors
Techno-pessimism
Artificial intelligence (AI)-related capital expenditure dominated headlines throughout 2025. According to (contested) estimates, 92% of US gross domestic product growth in the first half of the year was accounted for by investment in information-processing equipment and software.1 The theme, especially where hyperscalers are concerned, shows no signs of abating, continuing to drive the direction of equity market returns.
Yet more critical than the capex boom is its impact on macro-level productivity. Generative and agentic AI must ultimately deliver productivity gains to justify current valuations. Recent productivity data from early January 2026 are notable. The Bureau of Labor Statistics reported nonfarm business productivity increased 4.9% in Q3 2025, with Q2 revised upward to 4.1%, while unit labour costs declined for two consecutive quarters – a pattern not seen since 2019.2 Whether AI contributed remains unclear, and judging its impact on such a short horizon is premature, but the strength of these results is encouraging given the otherwise disappointing long-term trends.
Nobel laureate Robert Solow's observation in 1987 that "[y]ou can see the computer age everywhere but in the productivity statistics" remains disappointingly relevant. Figure 1 illustrates this paradox: total factor productivity (TFP) growth has trended downward in the post-World War II US economy despite waves of innovation, including the transition from analogue to digital technology. The 20-year rolling average peaked above 2% in the 1960s, then declined from the early 1970s onward to below 1% by the 2010s – a halving of productivity growth despite the digital revolution. This paradox is global, affecting other developed and emerging economies alike.
Figure 1. Rolling 20-year average annual growth in total factor productivity, Q2 1947 – Q3 2025
Problems loading this infographic? - Please click here
Most recent eight quarters
Problems loading this infographic? - Please click here
Source: Quarterly data. Man calculations and Federal Reserve Bank of San Francisco. John G. Fernald, “A Quarterly, Utilization-Adjusted Series on Total Factor Productivity.” FRBSF Working Paper 2012-19 (updated March 2014). Produced 8 January 2026 by John Fernald and Shane Boyle.
The drivers of this disconnect are disputed. The 1990s productivity acceleration (Figure 1) reflects this divide: Gordon (2016) dismisses the period as a “blip” in secular stagnation. Conversely, Brynjolfsson and Hitt (2000) argue that IT drove substantial firm-level gains, but aggregate statistics missed them by failing to measure intangible investments in organisational change and product quality.
Despite near-term uncertainty, AI's long-term potential appears distinctive: unlike previous technologies, it acts as both a tool and an agent. Imagine a world where digital researchers work alongside organic ones. We can use 'ideas' as shorthand for research-driven innovation that forms the engine of TFP growth. Bloom et al. (2020) present a stylised view where the flow of new ideas (which drives economic growth) is determined by:3
Idea flow = research productivity × number of researchers
AI could potentially address declining growth in new ideas through two channels: (1) augmenting human researchers to increase research productivity (i.e., the number of ideas generated per researcher), or (2) functioning as autonomous researchers that scale beyond demographic constraints. While human researchers are limited by demographics (approximately 1-2% annual growth), AI researchers could grow at significantly higher rates – and coordinate in ways humans cannot – providing a boost to innovation output even as research productivity declines. Man Group has already made some progress in this area, developing an agentic AI workflow that generates and evaluates quantitative research hypotheses.
From macro to micro data
Inspired by Bloom et al.’s sales-based analysis, we use gross profit growth as a simplified proxy for firm-level innovation outcomes (conceptually related to TFP growth in the broader economy).4 Gross profits are typically positive in consecutive years and capture both sales and cost of goods sold, either of which can be influenced by innovation. While imperfect – and also affected by pricing, mix, and M&A – it is a practical, consistently available signal rather than a precise measure.5
From 2005 to 2014, for example, Apple grew real gross profits6 by a staggering 32% per year on average. Over that same period, its median ‘effective’ number of employees engaged in R&D (R&Ders) was about 16,800 – a measure we calculate by dividing R&D spending by the average wage of skilled labour. So, Apple’s research productivity by our definition was 1.92% gross profit growth per thousand R&Ders. Over the last 10 years, Apple’s research productivity dropped from 1.92% to 0.04% per thousand R&Ders, implying a productivity contraction of an equally astonishing 39% per year. The pace of profit growth decelerated significantly (from 32% to 6%), even as investment in R&Ders surged (+22% per year). To put this in perspective: in the Jobs II era, it took roughly 520 researchers to generate a single percentage point of gross profit growth. Today, it takes the equivalent of over 25,000.7
Figure 2. Apple’s cratering productivity from 2005 to 2024
Problems loading this infographic? - Please click here
Source: Man Group calculations, S&P Compustat, US Census Bureau and US Bureau of Economic Analysis.
To elaborate on our R&Der measure:
R&D spending ÷ the average wage of skilled labour
Think of wages as a deflator of R&D spending. Growth in wages of skilled labour8 has generally outpaced other measures of inflation, including the GDP price deflator used for the real gross profit growth calculation above. Changing the frame of reference, we see that it also provides a measure of the number of ‘people’ engaged in research and development (hence R&Ders). Of course, it is possible for the number of R&Ders to exceed a company’s total employment, as we see with Apple since 2019 (see Figure 3).
Figure 3. Apple’s employees and effective R&Ders by year, 1980 to 2024
Problems loading this infographic? - Please click here
Note: Given we are looking at decade-on-decade changes, we use a rolling 10-year median of the average number of R&Ders at the beginning and end of each fiscal year for our productivity calculations for all companies (the dashed aqua blue line in the graph).
Sources: Man Group calculations, S&P Compustat, US Census Bureau.
When more doesn’t mean more
“Now, here, you see, it takes all the running you can do, to keep in the same place. If you want to get somewhere else, you must run at least twice as fast as that!”
— Lewis Carroll, Through the Looking-Glass
We would expect some reversion in profit growth after an extraordinarily productive period for Apple (e.g., iPhone and other innovations in the Jobs II era), but the fact that lower growth also came with a significant bump in R&Der investment highlights a broader issue with productivity.9 Though Apple represents an extreme case, it is not an isolated one and illustrates the broader challenge of diminishing returns to research where maintaining constant growth requires exponentially larger effort. As Bloom et al. show, this pattern holds across numerous sectors and industries.
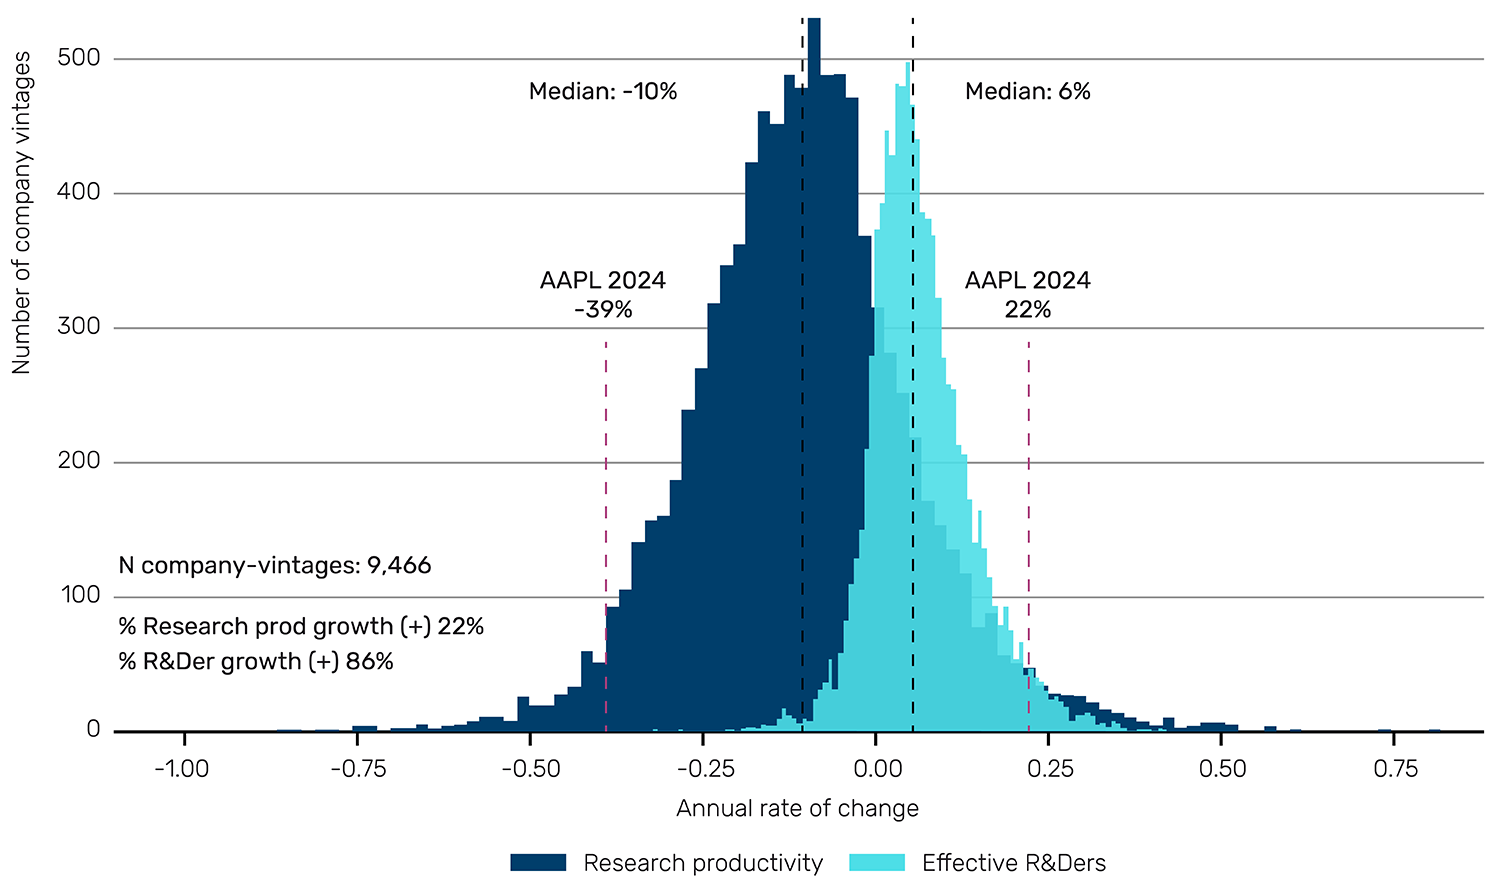
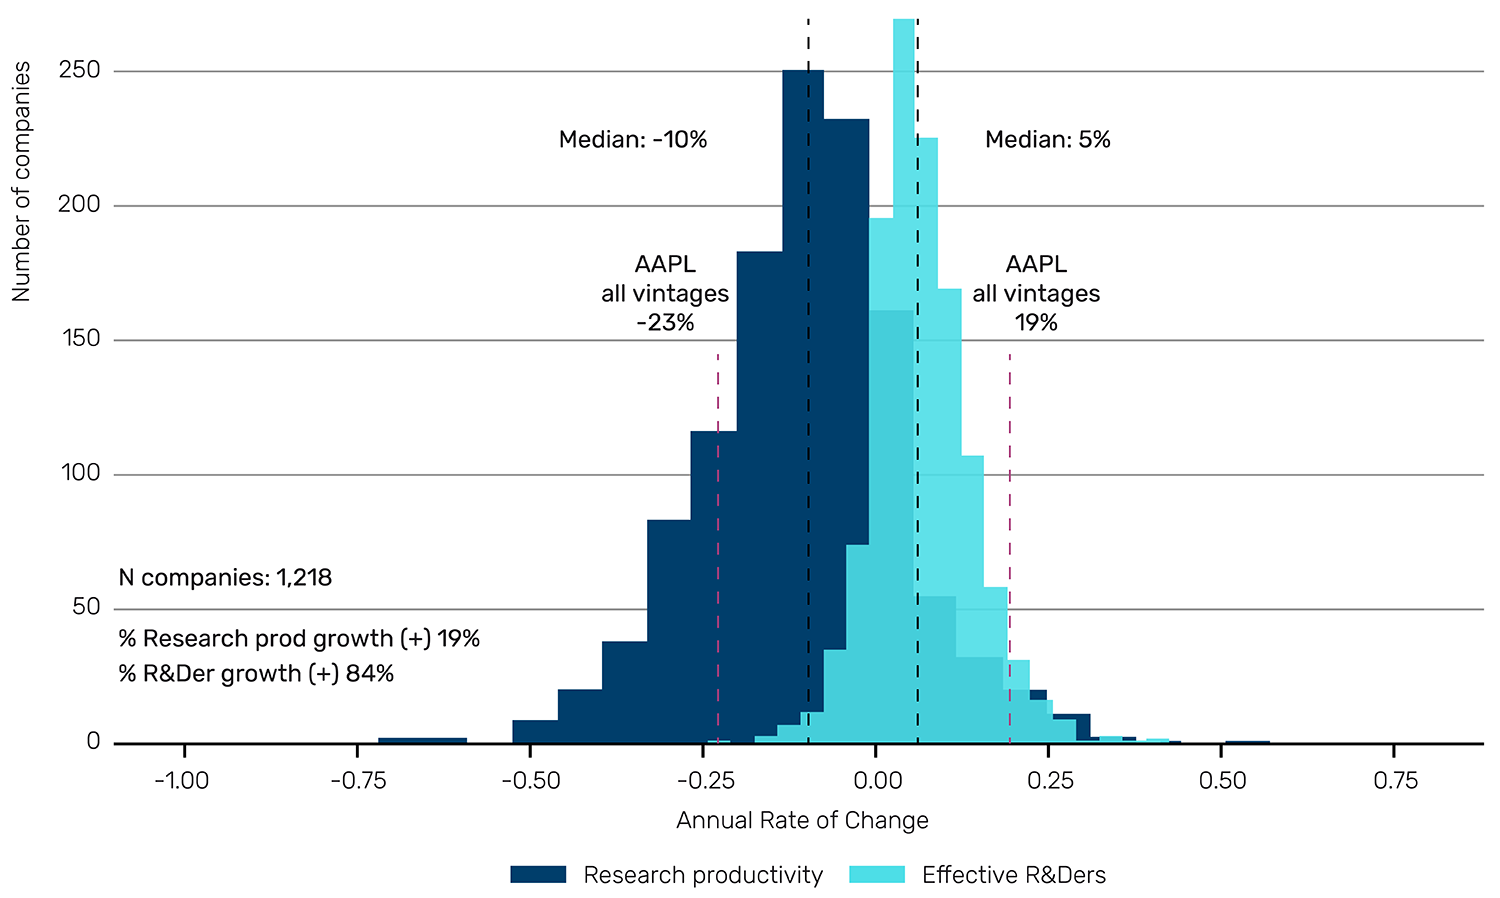
Figure 4 plots the distributions of the decade-on-decade annual rate of change in research productivity (navy blue) and number of effective R&Ders (aqua blue) for selected US non-financial companies drawn from annual Compustat data from 1975 to 2024.10,11 We show all company-vintages in the top panel and the data averaged by company across all available vintages in the bottom panel.
For reference, the data for Apple is labelled in both panels. Median research productivity growth was -10% with only 22% of the company vintages showing positive growth. Meanwhile, median growth in R&Ders was +6% with 86% of the company vintages showing positive growth. Results are similar for the company aggregated data in the bottom panel.
Figure 4. Annual change in research productivity and effective R&Ders, 1975 to 2024
Source: Man Group calculations, S&P Compustat, Center for Research in Security Prices, US Census Bureau, and US Bureau of Economic Analysis.
The data indicates that gross profit growth can be maintained only if R&D investment accelerates to offset the structural decline in productivity. For example, a company growing 5% per year in one decade could hope to maintain that same 5% in the next decade if it can invest enough in research to offset productivity loss (-10% + 10% growth in R&Ders = 0). This finding of declining research productivity holds as we further divide the data into rolling decade-on-decade vintages (see Figure A1 in the Appendix), use alternative measures to proxy the growth in new ideas (see Figure A2), calculate by industry (see Figure A3), or relax the constant returns to scale assumption (see Figure A4).
Declining research productivity is not confined to the US: despite debate about how best to measure “ideas” across sectors, replications and extensions find similar patterns internationally. Böing and Hünermund (2020) replicate Bloom et al.’s framework for Germany and China and find declines in both countries (with China’s estimated drop particularly steep). Miyagawa and Ishikawa (2019) report falling R&D efficiency across several advanced economies, with especially weak trends in Japan’s information services.
Maintaining or even improving gross profit growth is a reasonable company goal, but we believe investors ultimately care more about total profitability. Simply investing in R&D may or may not improve the bottom line. However, mixing digital and organic researchers could lower the effective cost of research capacity. If the cost savings (net of compute, data, and oversight) offset declining research productivity and rising skilled wages, the growth in gross profits less R&D should rise, all else equal.
Awaiting transformation
Bloom et al. document that research productivity has been declining by 5% to 10% annually for decades across multiple fields. Our company-level analysis finds consistent patterns: firms need growing R&D investment to maintain innovation output. Apple provides a stark illustration of this challenge with nine times more R&Ders across two decades yet slower profit growth.
History suggests patience is warranted. Previous general-purpose technologies took between 20 and 40 years to show productivity impacts. Electricity required around 40 years (David 1990), while computers took 25-35 years (Brynjolfsson and McAfee 2014; Fernald 2015). This delay often reflects a “Productivity J-Curve,” where initial adoption actually drags down efficiency as firms incur the costs of restructuring workflows before harvesting the benefits. However, early adoption patterns suggest AI may follow a faster trajectory. Data from the Penn Wharton Budget Model (PWBM) show that generative AI adoption at work is tracking similarly to personal computers in the early 1980s, but ahead of the internet, smartphones, and cloud computing at comparable stages (Bick et al. 2025). PWBM projects AI will add only 1.5% to GDP levels by 2035 – meaningful but modest.
If AI succeeds in reversing this research productivity decline, the long-term growth implications could be transformative: the difference between secular stagnation and sustained prosperity. Even without productivity gains, AI can augment total research capacity at rates far exceeding the approximate 1-2% demographic growth of human researchers.
We believe investors should therefore be sceptical of the 'AI Everywhere' narrative. Rather than waiting for aggregate productivity statistics, you might focus on currently high R&D-intensity firms (Software, Healthcare) and track firm-level indicators: gross profit growth outpacing R&D spending growth, research output metrics (scientific papers, patents, drug approvals), and any task-specific productivity measurements. Consequently, we think the earliest confirmation of AI’s economic promise may not be found in aggregate GDP statistics, but in micro-level indicators, especially at R&D intensive firms.
1. Post on X (formerly Twitter) by Jason Furman, a professor at Harvard University's John F. Kennedy School of Government, citing Bureau of Economic Analysis data. Furman posted this calculation on 27 September 2025: https://x.com/jasonfurman/status/1971995367202775284.
2. Bureau of Labor Statistics (BLS). (8 January 2026). Productivity and costs, third quarter 2025, preliminary. US Department of Labor. https://www.bls.gov/news.release/prod2.nr0.htm; Vince Golle, “US Productivity Accelerates to Fastest Pace in Two Years,” Bloomberg News, 8 January 2026.
3. This linear relationship assumes constant returns to scale (technically, a research elasticity of λ=1), implying that doubling the number of researchers simply doubles the flow of new ideas. In reality, researchers often duplicate efforts – a ‘stepping on toes’ effect that leads to diminishing returns (λ<1). We relax this assumption in Figure A4 and demonstrate that our findings of declining productivity hold across a range of elasticity parameters.
4. We follow Bloom et al. (2020)’s Compustat-based framework for measuring research input and output; our main modifications are using gross-profit growth (rather than sales) as the firm-level proxy for idea output, extending the sample period, and adding additional sensitivity tests. See footnotes 10-11 for sample construction and data sources.
5. Gross profit growth per effective R&Der is influenced by factors beyond organic innovation, including pricing power, market concentration, and M&A activity. While M&A effects can vary (e.g., 'acqui-hiring' versus buying revenue), factors like pricing power and concentration typically inflate gross profits without requiring proportional R&D effort. The fact that we still observe a secular decline in productivity despite these potential structural tailwinds makes the underlying trend even more significant. We therefore interpret these results directionally rather than causally.
6. We deflate gross profits by the GDP implicit price deflator provided by the US Bureau of Economic Analysis. Throughout our analysis, year-over-year growth rates are computed as (y₁-y₀) ÷ (0.5×y₁+0.5×y₀), following Davis et al (1996). This approach treats growth and decline symmetrically and is robust to measurement error. Results are similar using log differences.
7. Calculated as 1,000 / 1.92 ≈ 520 and 1,000 / 0.04 ≈ 25,000. This approximate 49x increase in the ‘human cost of growth’ illustrates why linear hiring is no longer a sustainable strategy for maintaining growth rates.
8. Due to historical and continued biases, we use the mean earnings for males, four or more years of college/grad school education. Source: US Census Bureau.
9. Apple is an extreme illustration and reflects additional forces (e.g., smartphone market saturation, intensifying competition, product-cycle maturity, and scale effects at very large market cap), not just research productivity.
10. We include only companies with R&D spending, at least five annual observations in both 10-year periods, and with positive average gross profits growth in both periods. This growth requirement creates a purposeful selection bias toward successful firms; by excluding companies in structural decline, we demonstrate that diminishing research productivity is a challenge even for the economy’s most consistent performers. While this naturally selects for established survivors (approximately 10+ years of data), our findings remain robust across varying vintage start dates (see Figure A1). We exclude companies in the financials sector and ADRs.
11. Source: Man Group calculations, S&P Compustat, Center for Research in Security Prices (CRSP), US Census Bureau (wage data), and US Bureau of Economic Analysis (price deflator).
References
Autor, D. H. (2015). Why are there still so many jobs? The history and future of workplace automation. Journal of Economic Perspectives, 29(3), 3–30. https://doi.org/10.1257/jep.29.3.3
Bessen, J. (2015). Toil and technology. Finance and Development, 52(1), 16–19.
Bick, A., Blandin, A., & Deming, D. J. (2025). The rapid adoption of generative AI (NBER Working Paper No. 32966, revised February 2025). National Bureau of Economic Research. https://doi.org/10.3386/w32966
Bloom, N., Jones, C. I., Van Reenen, J., & Webb, M. (2020). Are ideas getting harder to find? American Economic Review, 110(4), 1104-1144. https://doi.org/10.1257/aer.20180338
Böing, P., & Hünermund, P. (2020). A global decline in research productivity? Evidence from China and Germany (ZEW Discussion Paper No. 20-030). ZEW - Leibniz Centre for European Economic Research.
Brynjolfsson, E., & Hitt, L. M. (2000). Beyond computation: Information technology, organizational transformation and business performance. Journal of Economic Perspectives, 14(4), 23-48. https://doi.org/10.1257/jep.14.4.23
Brynjolfsson, E., & McAfee, A. (2014). The second machine age: Work, progress, and prosperity in a time of brilliant technologies. W. W. Norton & Company.
David, P. A. (1990). The dynamo and the computer: An historical perspective on the modern productivity paradox. American Economic Review, 80(2), 355-361.
Davis, S. J., Haltiwanger, J., & Schuh, S. (1996). Job creation and destruction. MIT Press.
Fernald, J. G. (2015). Productivity and potential output before, during, and after the Great Recession. NBER Macroeconomics Annual, 29(1), 1-51. https://doi.org/10.1086/680580
Gordon, R. J. (2016). The rise and fall of American growth: The U.S. standard of living since the Civil War. Princeton University Press.
Miyagawa, T., & Ishikawa, T. (2019). On the decline of R&D efficiency (RIETI Discussion Paper Series No. 19-E-052). Research Institute of Economy, Trade and Industry.
Penn Wharton Budget Model. (2025). The projected impact of generative AI on future productivity growth. University of Pennsylvania. https://budgetmodel.wharton.upenn.edu/issues/2025/9/8/projected-impact-…
Solow, R. M. (1987, July 12). We'd better watch out. New York Times Book Review, 36.
Appendix
Figure A1. Median annual change in research productivity & effective R&Ders by vintage, 1975 to 2024
Problems loading this infographic? - Please click here
Note: n = number of companies in each decade-over-decade vintage based on screening criteria presented in footnote 10.
Sources: Man Group calculations, S&P Compustat, Center for Research in Security Prices, US Census Bureau, and US Bureau of Economic Analysis. Analysis of US listed companies only.
Figure A2. Annual change in research productivity & effective R&Ders for selected growth in ideas metrics, 1975 to 2024
Problems loading this infographic? - Please click here
Notes: The most recent three vintages include: (i) 2003-12 versus 2013-22; (ii) 2004-13 versus 2014-23; (iii) 2005-14 versus 2015-24. Patent grants have been shown to be positively correlated to firms’ future growth in sales, employment, and market cap.
Sources: Man Group calculations, S&P Compustat, Center for Research in Security Prices, US Census Bureau, and US Bureau of Economic Analysis. Analysis of US listed companies only.
Figure A3. Annual change in research productivity & effective R&Ders by industry, 1975 to 2024
Problems loading this infographic? - Please click here
Notes: Industry definitions based on Fama-French 12-industry portfolio construct. Excludes ‘other’ industry category and any industry with fewer than 100 observations.
Sources: Man Group calculations, S&P Compustat, Center for Research in Security Prices, US Census Bureau, US Bureau of Economic Analysis, and Kenneth French (https://mba.tuck.dartmouth.edu/pages/faculty/ken.french/Data_Library/de…). Analysis of US listed companies only.
Figure A4. Annual change in research productivity & effective R&Ders for various returns to scale parameters (λ), 1975 to 2024
Problems loading this infographic? - Please click here
Notes: Results based on rolling 10-year windows using gross profit growth, 1975-2024. λ transforms effective research input as (number of researchers)λ. All specifications show significant productivity decline, confirming our qualitative finding is robust. Sample includes 1,218 unique firms with 9,466 company-vintage observations.
Sources: Man Group calculations, S&P Compustat, Center for Research in Security Prices, US Census Bureau, and US Bureau of Economic Analysis. Analysis of US companies only.
You are now leaving Man Group’s website
You are leaving Man Group’s website and entering a third-party website that is not controlled, maintained, or monitored by Man Group. Man Group is not responsible for the content or availability of the third-party website. By leaving Man Group’s website, you will be subject to the third-party website’s terms, policies and/or notices, including those related to privacy and security, as applicable.