Introduction
Investors often must navigate a combination of cyclical and secular forces, ranging from geopolitical unrest to volatile inflation. Natural resource investments, referring to assets which derive from nature such as agriculture, oil and gas, and metals, are often overlooked by investors but we believe, in today’s world, they should form a core part of any well-diversified portfolio. In this paper, we outline some of the key attributes of the asset class which lead us to this conclusion, including:
- Natural resources have ranked among the most effective hedges against inflation and may offer protection in various market environments.
- They have tended to have a low correlation to other major asset classes.
- Each commodity is exposed to a unique supply and demand dynamic which drives distinct price performance, creating opportunities to generate alpha.
- The commodities market has offered high liquidity owing to its long-established and developed nature.
- Natural resources can offer protection against volatility induced by geopolitical conflict.
Let’s dive in.
1. Potential for protection in various market environments
The commodities complex provided both real returns, as well as a high hit rate, in various historical inflationary environments.
In times of inflation volatility, investors often flock to real estate, infrastructure or private investments. These asset classes may offer some degree of protection but historical data shows that natural resources rank among the most effective. Table 1 shows that the commodities complex provided both real returns, as well as a high hit rate, as defined below, in various historical inflationary environments. While the sharp inflationary spikes of recent years are likely anomalies, the low inflation environment of the past several decades is unlikely to be the norm going forward. In an environment where market and inflation volatility persists, we believe that natural resource equities can offer potential protection and real returns in various market environments.
Table 1. Commodity futures returns during historical US inflationary episodes and annualised returns during inflationary and non-inflationary times
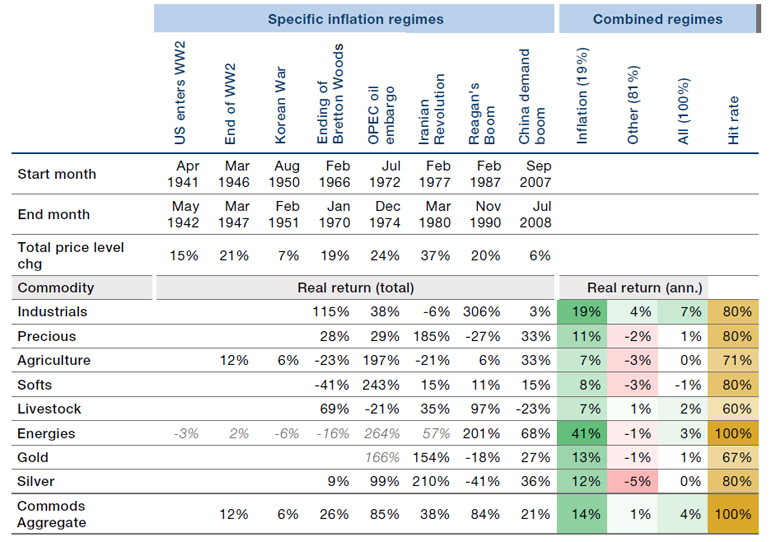
Past performance is not indicative of future results.
Source: Reproduced from H. Neville, T. Draaisma, B. Funnell, C. R. Harvey and O. van Hemert, “The Best Strategies for Inflationary Times,” The Journal of Portfolio Management, vol. 47, no. 8, August 2021. Returns in grey extend history using spot returns. The hit rate is the proportion of inflationary periods with positive returns. The periods selected are exceptional and the results do not reflect typical performance. The start and end dates of such events are subjective and different sources may suggest different date ranges, leading to different performance figures.
Historical precedent shows that commodity demand destruction from economic slowdowns is more limited than generally perceived, as well as isolated to certain commodities rather than broad based.
A common argument is that a bearish economic cycle will derail commodity prices. Separating myth from reality is important here. Firstly, historical precedent shows that commodity demand destruction from economic slowdowns is more limited than generally perceived, as well as isolated to certain commodities rather than broad based. Secondly, demand tends to return to growth trends within a relatively short period of time. In many cases, the severity of commodity downturns depends as much on supply response. Furthermore, occurrences of “stagflation” – a low growth, inflationary environment – are quite rare, with the main recorded instance in the 1970s when global markets were hit by a combination of supply shock (oil embargo) and ineffective central bank policies. If the 1970s cycle serves as a precedent, commodities offered one of best offensive and defensive investments. It is also interesting to note that commodities’ outperformance in the 1970s was not isolated to the energy complex, but was rather experienced across agriculture and precious metals.
Economic cycles will rise and fall but consumption will remain a constant trend.
How can commodities outperform if economic growth is low or negative? Contrary to popular belief, natural resources demand is not as price sensitive as commonly perceived. Indeed, it is generally supply response that ends commodity cycles. When viewed through a long term, multi-decade lens, we can see that consumption of commodities (showing grains and steel as an example in Figure 1 and 2 below) trends steadily higher, with economic shocks like the Global Financial Crisis (GFC) being fairly small blips in the overall bigger picture. As an example, during the depths of the GFC, peak quarterly crude oil demand saw only a 3% decline to the trough and by 2009-2010, global oil demand had rebounded to new highs. Economic cycles will rise and fall but consumption will remain a constant trend.
Figure 1. Global corn and soybean consumption
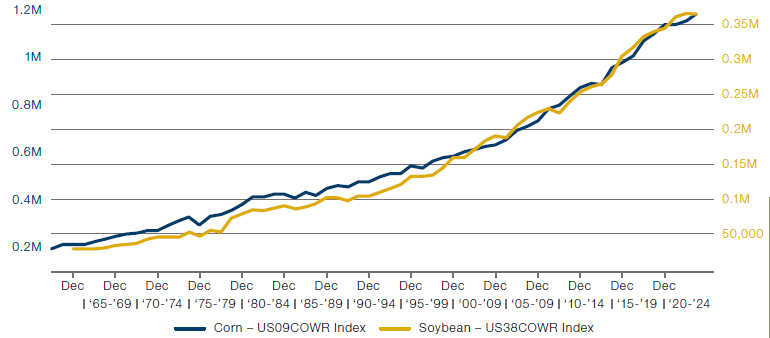
Source: Bloomberg, as of 31 December 2022.
Figure 2. Global steel production
Problems loading this infographic? - Please click here
Source: worldsteel.org, 1950-2021. Available here: https://worldsteel.org/steel-topics/statistics/world-steel-in-figures-2022/
2. Low correlation to other major asset classes
One of the most important characteristics of the natural resource asset class is its low correlation to other major asset classes.
One of the most important characteristics of the natural resource asset class is its low correlation to other major asset classes. Using the Bloomberg Commodity Index as a proxy, we analysed the correlation of natural resources to both equities and bonds across various timeframes, as well as during significant market events. The low correlations are particularly remarkable from a long term perspective (when economic and/or commodity cycles are smoothed out). During extraordinary market events such as the GFC or Covid-19 pandemic, correlations with other assets can temporarily ‘go to one’ but will revert to the historic low correlation shortly thereafter.
Table 2. Correlation with equities and bonds
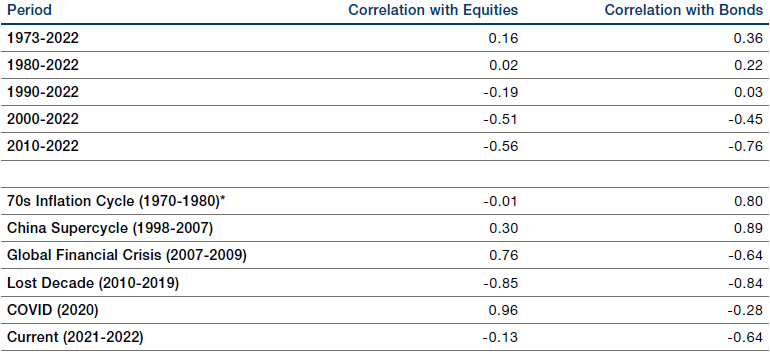
Past performance is not indicative of future results.
Source: Bloomberg, as at 30 December 2022. Equities represented by the S&P 500 Index and bonds represented by the Bloomberg US Treasury Index.
* Bond correlation from 1973-1980. The periods selected are exceptional and the results do not reflect typical performance. The start and end dates of such events are subjective and different sources may suggest different date ranges, leading to different figures.
3. Idiosyncratic characteristics of natural resources drives dispersion of returns
Each commodity is exposed to a unique supply and demand dynamic that drives distinct price performance, regardless of broader systematic trends.
Dispersion is a vital feature of investing in natural resources. Each commodity is exposed to a unique supply and demand dynamic that drives distinct price performance, regardless of broader systematic trends. For example, in the broader metals and mining universe, iron ore demand will be primarily driven by Chinese property and infrastructure consumption while another metal like copper will have a more diverse set of consumption drivers such as energy transition uses. For natural resource equities, the average dispersion (measured by the average performance in the top 50% versus the bottom 50%) is close to 50% (see Figure 3). This is among the widest across asset classes and can create meaningful opportunities for active investors.
Figure 3. Wide dispersion of returns in the S&P Global Natural Resources Index
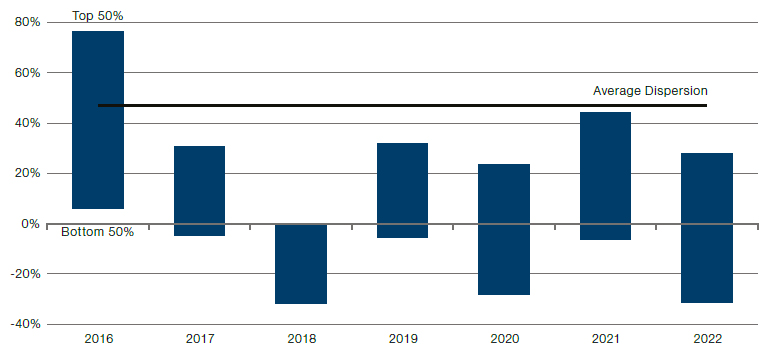
Source: Bloomberg, as at 31 December 2022. Based on annual returns of S&P Global Natural Resources Index. Shows the difference between the average of the top 50% and bottom 50% index constituents.
4. Liquidity and daily mark-to-market
Given the size of the physical market, the daily financial market is consequently highly liquid, providing a daily and constant mark-to-market on price.
Commodities are one of the basic building blocks of the global economy and the market is long-established and developed. As of June 2023, the annual market size of oil surpassed $2 trillion (market size measured as 2022 production multiplied by June 2023 prices). The largest metals markets as illustrated by iron ore, gold and copper were $283 billion, $196 billion and $183 billion, respectively. Given the size of the physical market, the daily financial market is consequently highly liquid, providing a daily and constant mark-to-market on price. Within listed public equities, the three-month average daily traded volume for the S&P Global Natural Resources Index is estimated to be in the range of $7.5-8 billion at the time of writing.
Figure 4. Market size of oil compared to top 10 metals worldwide (in billion USD)
Problems loading this infographic? - Please click here
Source: Visual Capitalist, as of 7 June 2023. In Statista. Retrieved January 2024 from https://www.statista.com/statistics/1404193/oil-vs-metals-market-size/.
5. Protection against geopolitical tensions
As geopolitical tensions continue to shift and grow in the future, commodities will be increasingly ‘weaponised’ and we believe the natural resource equity complex will be one of the most effective means of hedging the resulting price volatility.
In recent years, we have seen an emergence of a multi-polar world and a slow breakdown of historical social and economic conventions. From the rise of China as an economic superpower to the increased military activism seen in Russia/Ukraine and the Middle East, there is an underlying power paradigm change. For investors, geopolitical shifts and spikes are difficult to hedge against. One overarching factor that links many geopolitical events is commodities. The natural resource world is bifurcated between the ‘have’ and ‘have nots’, with production often concentrated in the hands of a few producers. Using wheat as an example, the top 10 wheat exporters in the world account for more than 80% of total global export volumes (see Figure 5). Even more alarming, the Russia/Ukraine region accounts for between 30-40% of global total exports. Even non-traditional areas like renewables are often dominated by one or two countries. China, for example, controls most of the solar supply chain (see Figure 6), as well as other critical areas like rare earth. As geopolitical tensions continue to shift and grow in the future, commodities will be increasingly ‘weaponised’ and we believe the natural resource equity complex will be one of the most effective means of hedging the resulting price volatility.
Figure 5. 2020 world’s largest wheat exporters

Source: Statistica. Available here: https://www.statista.com/chart/26928/largest-wheat-exporters/.
Figure 6. China dominated all steps of solar panel production

Source: Bloomberg. Countries refer to headquarters, rather than factory locations, though no Chinese polysilicon manufacturer has significant capacity outside of China.
Conclusion
Our goal in this paper was to outline the potential benefits of investing in natural resources, particularly given the unique combination of cyclical and secular forces investors face today. We find that natural resources have a low correlation to other major asset classes and can offer protection in various market environments, including inflation and in the face of geopolitical tensions, while the unique supply and demand dynamics of individual commodities within the asset class creates opportunities to generate alpha.
In Part II of this series, we will explore what we believe are the benefits of investing in natural resource equities over and above natural resource futures.
Disclosures
One should carefully consider the risks associated with investing, whether the strategy suits your investment requirements and whether you have sufficient resources to bear any losses that may result from an investment.
Commodity Risk: The value of commodities can be volatile and may carry additional risk. Commodity prices can also be influenced by the prevailing political climate and government stability in commodity producing nations.
Market Risk: Commodity and natural resource investments are subject to normal market fluctuations and the risks associated with investing in domestic and international securities markets; therefore, the value of your investment and the income from it may rise as well as fall and you may not get back the amount originally invested.
You are now leaving Man Group’s website
You are leaving Man Group’s website and entering a third-party website that is not controlled, maintained, or monitored by Man Group. Man Group is not responsible for the content or availability of the third-party website. By leaving Man Group’s website, you will be subject to the third-party website’s terms, policies and/or notices, including those related to privacy and security, as applicable.