Introduction
The coronacrisis has left markets reeling. Equity volatility is up, credit spreads are heightened, and around the world, investors are trying to work out how to plug the gaps in their portfolios.
In contrast, the convertible bond primary market is quietly thriving.
Indeed, 2020 has seen record levels of new issuance for some regions, with a large number of first-time issuers coming to market. This is a boost to the asset class and broadens the opportunity set available, in our view.
Additionally, convertibles have cheapened to levels not seen for a number of years, offering investors a potentially attractive entry point to invest in the market.
Last but not least, given their convex profile, convertible bonds can potentially offer the best of both worlds against the uncertain backdrop i.e. they can behave more like equities in rising markets, while providing downside risk mitigation by behaving more like bonds in market selloffs.
A Review of 1H 2020
After a positive start to the year, global convertibles sold off in line with other risk assets in March, though outperformed global equities and high yield credit. On a regional basis, the US was the worst performer, owing to the market’s higher delta profile, combined with its larger share of high-beta names. The energy sector was a notable detractor following the collapse of OPEC+ and due to global slowdown fears.
Risk assets bounced sharply off their March lows and have now largely recovered their losses, while volatility has trended lower following a spike in the CBOE VIX Index to a level not seen since 2008. Despite the aforementioned weakness in the first quarter, the US leads the way in terms of year-to-date regional performance in the convertibles market after a very strong second quarter. In fact, despite the S&P 500 Index remaining in negative territory at the end of the first half (-4%), US convertibles are up more than 7%.
Figure 1. Global Convertibles Index Versus Global Equities Index
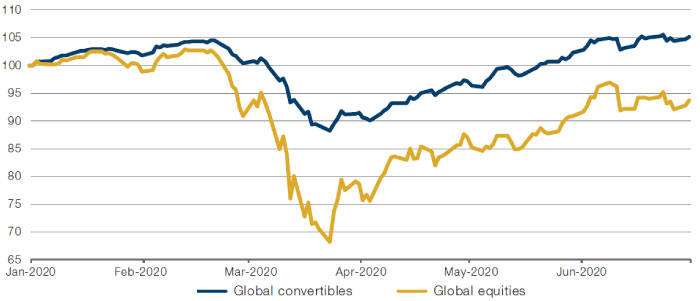
Source: Bloomberg; as of 30 June 2020. Indices used: Thomson Reuters Focus CB Index, MSCI AC World TR Index. Indexed to 100 on 31 December 2019.
During the 2020 market selloff (between 19 February and 23 March), global convertibles fell 15.6%, while global equities plummeted 33.6%. So, the decline in global convertibles equated to 46.5% the fall in global equities. The market recovery (between 24 March and 30 June) saw global convertibles advance 17.5%, while global equities rallied 37.5%. So, global convertibles captured 46.7% of the move higher in equities. This is a pattern that can be observed at numerous other points in time: for example in 2019, global equities posted returns of 26.6% and global convertibles participated in 49.2% the upside. 2018 was a more challenging year and global equities fell 9.41%, while global convertibles caught a third (31.9%) of that decline.
New Issuance
2020 has been an extremely active year so far in the global convertibles market. Issuance is running at more than twice the level we witnessed at the same time last year. The US, in particular, continues to blast through multi-year records for monthly issuance as increasingly more diverse companies are turning to the convertibles market to raise capital. This surge in issuance, from a broad range of companies, has raised the profile of the convertibles market and attracted new investors to the space. Together, this has helped further improve the liquidity of the market and trading volumes are now at levels not seen since 2011.
Indeed, issuance in just the first half of 2020 is higher than all of 2019 (which itself turned out to be a strong year), despite the heavy selloff in global markets in February and March. Volumes began to really surge in April as cash-strapped firms – primarily in the heavily impacted US travel and retail sectors – turned to the convertible-bond market for rescue financing to shore up their balance sheets. As markets moved higher through April and May and global convertibles continued their recovery, we saw a shift in the issuer mix back towards the more traditional convertible sectors as firms sought funds opportunistically to capitalise on high stock prices and high stock volatility. Overall, the US saw its largest amount of monthly issuance on record in April at just under USD21 billion. Indeed, over April and May, the US saw almost USD35 billion of new paper – the largest amount of issuance ever on a size-adjusted basis.
Interestingly, primary activity in April was higher in the US convertible market than the equity market for the first time since 2008. For the first half as a whole, issuance reached USD92 billion globally, of which USD67 billion came from the US – both of which are first-half records (Figure 2).
Figure 2. Convertible Bond Issuance – First Half and Expected
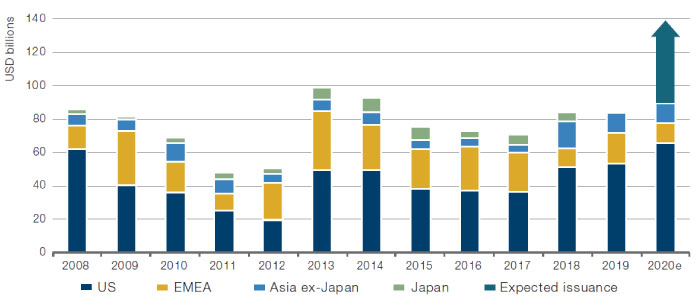
Source: Man Group, Bank of America-Merrill Lynch; as of 30 June 2020.
What is interesting in all of this is that convertible bond issuance has remained strong despite very low and declining interest rates, which theoretically acts as a headwind. This is because as the cost of capital falls with interest rates, issuers have less incentive to issue dilutive convertibles versus more traditional (and non-dilutive) straight debt. However, it is likely that wide credit spreads have acted as an offset to this and we believe that while spreads remain at current levels, convertible bond issuance is likely to remain strong. Further, with interest rates so low we believe interest rate risk is skewed to the upside at current levels and an increase in interest rates benefits convertibles due to their lower duration than straight bonds.
If markets turn lower again in the second half of 2020, we may see another pick-up in issuance from firms seeing to resolve near-term liquidity problems.
Value
Despite the recovery in global markets since the March lows, global convertibles remain significantly cheap versus their theoretical values (Figure 3).
At the end of March, with around two-thirds of the universe trading below par (up from 30% at the end of 2019) and average convertible-bond deltas moving significantly lower to levels not seen since 2012 (~0.33), the market had cheapened significantly – particularly in the US. This was largely driven by the selloff, as the majority of the spike in trading volumes (which reached the highest level since 2011 on a market-size adjusted basis) was from selling as investors sought to meet margin calls and fund redemptions. We also saw mandatory convertible bonds cheapen even more than the overall convertible bond market since a lot of these are included in ETFs which were forcibly sold.
At the end of May, global convertibles were in their 94th percentile of cheapness since 1999 – for US and European convertibles the figure was 93rd and 87th, respectively. One of the reasons the market has remained cheap, despite the recovery, is because of the large amount of new issuance which has been priced to sell. These low-priced offerings have increased the overall level of market cheapness, even as pre-existing convertibles recovered well. Further, while volatility has indeed declined from the peak in March, long-term volatility remained elevated (and indeed remains at high levels at the time of writing), while credit spreads have tightened from prior wides, therefore boosting theoretical values. With macro uncertainty remaining high, we believe there will be many occurrences of increased volatility going forward.
Figure 3. Cheapness Analysis
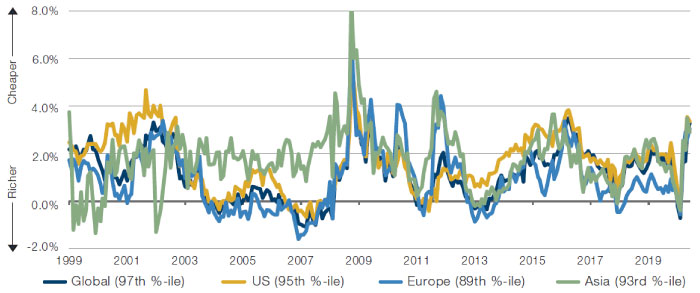
Source: Bank of America-Merrill Lynch; as of 30 June 2020.
Outlook
The emergency fiscal and monetary policies have helped ease investor concerns and reduce volatility in markets. The gradual re-opening of economies will help bring a much-needed boost to global growth and macroeconomic data has started to show signs of a recovery, while risk assets have rebounded from their March lows.
Still, we believe markets remain vulnerable and a second wave of infections along with the shutting down of economies could cause risk assets to sell off again. Given their convex profile, convertible bonds can potentially offer the best of both worlds against the uncertain backdrop i.e. they can behave more like equities in rising markets, while providing downside risk mitigation by behaving more like bonds in market selloffs.
Risks
Convertible bonds generally offer investors a lower coupon than comparable straight debt, thus making straight debt more attractive to income-focused investors who only care about receiving a regular interest payment. Secondly, in a consistently rising equity market, convertibles tend to lag equities due to their lower average delta, or equity sensitivity. However, this is compensated for by their downside risk mitigation features, which soften losses when equities decline.
You are now leaving Man Group’s website
You are leaving Man Group’s website and entering a third-party website that is not controlled, maintained, or monitored by Man Group. Man Group is not responsible for the content or availability of the third-party website. By leaving Man Group’s website, you will be subject to the third-party website’s terms, policies and/or notices, including those related to privacy and security, as applicable.