Introduction
In conversations with asset owners and allocators, a question often arises about the merits of allocations to Asia ex-Japan versus Emerging Markets (‘EM’) more broadly. The authors have some perspective on this: Andrew has worked in Asian financial markets for 25 years, and Ed in EM for nearly 20. The truth of the matter is (and for those impatient for a conclusion) there is not much difference when it comes to beta. Where there are differences in beta, they are hard to forecast and time-varying. The real conversation should be about the opportunity to generate alpha.
Still, we’ve talked a lot recently about the alpha opportunity. So, for the purposes of this article, we will focus more on the beta discussion: correlation, what contributes to the differences in risk profile (hint, the US dollar), how they can be exploited. And finally, because we’re dogged, the breadth of the opportunity, which ultimately is about alpha.
Which Beta’s Better?
Looking at 2-year rolling periods over the last 20 years, the correlation of EM and Asia ex-Japan to MSCI ACWI is largely indistinguishable. This isn’t particularly surprising – at the end of 2020, Asia ex-Japan accounted for 80% of MSCI EM by freefloat market cap. But even after the Global Financial Crisis, when Asia was close to 60% of MSCI EM, the correlation was almost indistinguishable.
Figure 1. MSCI Asia ex-Japan and EM, 2-Year Rolling Correlation to MSCI ACWI
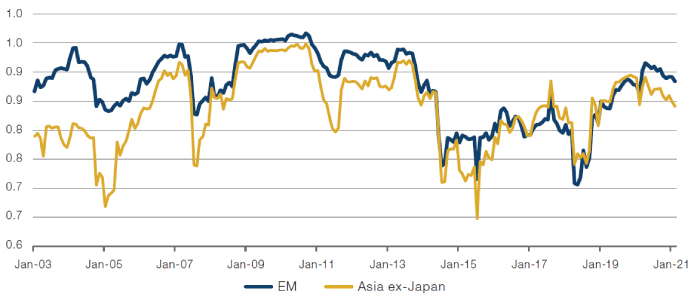
Source: Man Group, Bloomberg, MSCI; as of 26 February 2021.
Contrast, for example, the correlations of Europe and Japan to ACWI. Here, the regional idiosyncrasies are materially more obvious, particularly for Japan.
Figure 2. MSCI Japan and Europe, 2-Year Rolling Correlation to MSCI ACWI
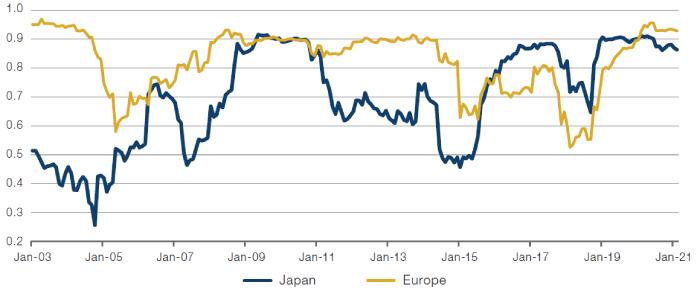
Source: Man Group, Bloomberg, MSCI; as of 26 February 2021.
The common thread between Asia and other EM is, in our opinion, the sensitivity to the US dollar. In most developed markets, currency weakness is a hard-earned privilege, where foreign investors typically want to buy more of a country’s assets when the currency weakens for idiosyncratic reasons (Brexit is a notable exception for UK assets). In EM, both foreign and domestic investors typically head for the door at the same time when currencies devalue, and financial conditions tighten. This is evident in the persistently negative beta of Asia ex-Japan and EM ex-Asia to the dollar index (DXY), shown in Figure 3.
While both regions follow an almost identical path in terms of trend, the beta for EM ex-Asia is more elevated, reflecting the tendency for larger non-Asian countries to be either resource exporters (Russia, Brazil, Mexico and South Africa) and for many of these countries to run relatively persistent external deficits (Brazil, South Africa, Turkey and Mexico). In part at least, the beta component of both the Asian and non-Asian constituents of the EM universe is a play on the US dollar. With this in mind, there is a case to be made for allocators with a claim to forecasting currency trends to favour broader EM over Asia, or for a more extreme expression, EM ex-Asia over EM, at various points in the cycle. However, there are few things as difficult as forecasting currency reliably. And as we argue below, there is sufficient breadth in economic characteristics in Asia between the surpluses of the north and the deficits and relative macro vulnerabilities of the south that a flexible strategy can compensate tactically for the absence of non-Asian deficits when conditions allow.
Figure 3. MSCI Asia ex-Japan & EM ex-Asia, 2-Year Rolling Beta to US Dollar Index
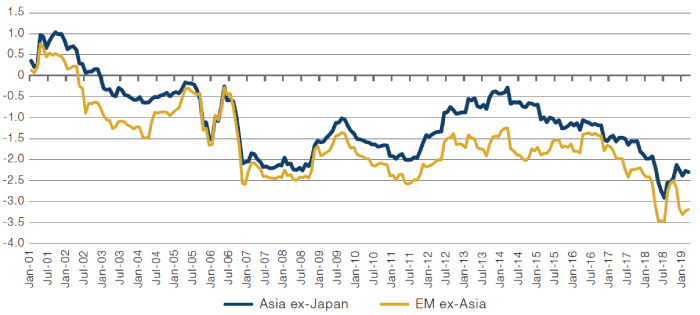
Source: Man Group, Bloomberg, MSCI; as of 26 February 2021.
Opportunities in Carry Markets
One of the dirty secrets of EM fixed income and FX is that carry is something you see, but rarely actually get. Bloomberg’s EM FX Carry Index has compounded returns of 3.7% annualised over the last 21 years, against annualised volatility of c. 10%. The only thing constant about this period has been the volatility: returns were +8.8% annualised from 2000 to 2010, and -13.7% annualised from 2010 to date.
Again, this mostly comes back to the US dollar. Carry has worked best when there is a weak US dollar environment, and vice versa, as shown in Figure 4.
Figure 4. Bloomberg EM Carry and Fed Broad Dollar Index Monthly Returns
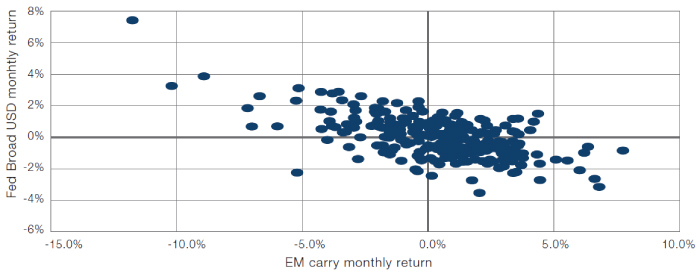
Source: Man Group, Bloomberg, Federal Reserve; as of 26 February 2021.
As we outline above, EM ex-Asia has a tendency towards greater external deficits, and hence higher carry. A practical heuristic for Asia is that it is bifurcated into a higher income, savings-rich, manufacturing north, which enjoys surpluses; and a lower income, often resource exporting south, with deficits. Twelve-month returns for these two opposing buckets relative to Asia ex-Japan are clearly inversely correlated over the last decade, as shown in Figure 5.
Figure 5. North Asia and South Asia, 12-Month Returns Relative to MSCI Asia ex-Japan
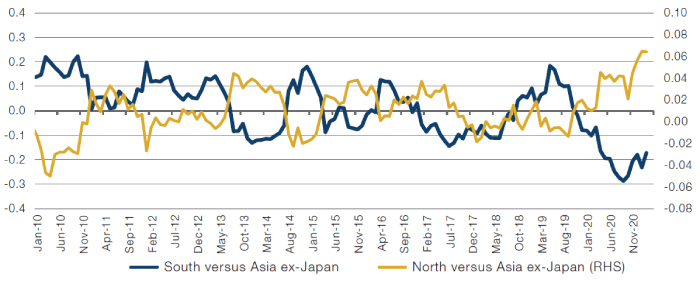
Source: Man Group, Bloomberg, MSCI; as of 26 February 2021.
As with much of what we’ve written above, the key variable in this is the US dollar. Consider, below, the relationship between the volatility adjusted returns of EM ex-Asia and the carry markets of the Asian south, and the US dollar.
Figure 6. North Asia and South Asia, 12-Month Returns Relative to MSCI Asia ex-Japan
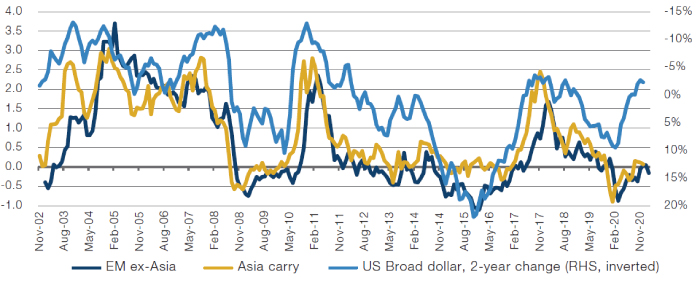
Source: Man Group, Bloomberg, MSCI, Federal Reserve; as of 26 February 2021.
The point here is that there is enough variety in structural macro characteristics in Asia that an investment strategy with sufficient flexibility in country allocations can tactically tilt towards the weaker economies – those dependent on commodity exports, or running structural deficits and are more sensitive to fluctuations in the US dollar – when conditions are supportive. And that the macro behavioural similarities of these markets to their counterparts in EM ex-Asia means that the broader attributes of EM can be captured in flexible strategies.
It All Comes Down to the Alpha Opportunity
All of the above relates to beta and can be summarised as follows: the non-Asian part of EM is more vulnerable to external conditions, and there’s enough macro vulnerability in the Asian south to compensate for the absence of Latam and EMEA when specific conditions – a sustained weak US dollar – arise.
But the real truth of the story is that what matters most is the alpha opportunity, and that alpha opportunities are greatest where there is breadth in independent bets. This is a central tenet in Richard Grinold and Ronald Kahn’s Fundamental Law of Active Management. For liquid public market strategies, we are acutely aware that bets need not just be independent, but sufficiently liquid too. Figure 7 filters the emerging markets index for companies trading more than USD15 million per day, and calculates the average pairwise correlation for these stocks. On average, EM ex-Asia has a pairwise correlation weighted by number of stocks at 0.45, versus 0.3 for Asia. Also, the number of liquid stocks outside Asia is very low: just 139, versus 913 in Asia. Only Brazil has anything approaching a broad investable universe at 50 liquid stocks, but this comes with a lower degree of stock independence than anywhere in Asia.
Figure 7. EM ex-Asia and EM Asia, Pairwise Correlation for Stocks > $15m Average Daily Value Traded
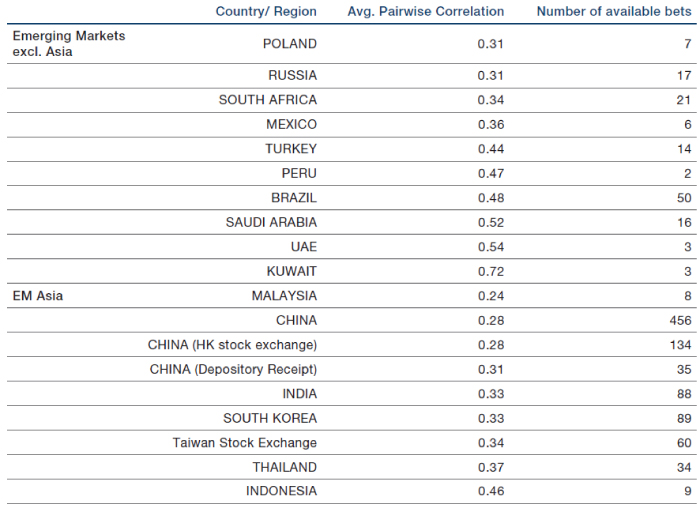
Source: Man Group, Bloomberg, MSCI; as of 26 February 2021.
From our perspective, the best utilisation of our resources is to focus on uncovering differentiated, independent investment opportunities. A small slice of deliberate macro input can materially improve returns at various points in the cycle. But the secret to enduring outperformance is a diversified portfolio.
You are now leaving Man Group’s website
You are leaving Man Group’s website and entering a third-party website that is not controlled, maintained, or monitored by Man Group. Man Group is not responsible for the content or availability of the third-party website. By leaving Man Group’s website, you will be subject to the third-party website’s terms, policies and/or notices, including those related to privacy and security, as applicable.