Tariff related uncertainty has caused wild swings across markets. At the time of writing, we’ve witnessed a temporary truce between the US & China, however, see-sawing trade policy and a ticking clock on negotiations across the world are elevating uncertainty to unprecedented levels.
Nowhere has this been more evident than the US stock market where we’ve observed double digit drawdowns and recoveries in the space of only a few weeks. Whilst US equities have rebounded, tension remains high as geopolitical news is impacting market sentiment on almost a daily basis.
Figure 1. 2025 S&P 500 and Global High Yield Markets (USD Hedged): Similar Returns, A Very Different Journey
Problems loading this infographic? - Please click here
Source: ICE BofA and Bloomberg as at 28 April 2025. Data based on ICE BofA Global High Yield Index (HW00 Index) and the S&P500 Index.
Given this turbulence, we believe that high yield bonds may represent an attractive alternative to equities. As investors are still recovering from their rollercoaster rides in the equity market, the overall high yield market has continued to deliver consistent returns, solid income and lower drawdowns. Furthermore, the all-in yields of the asset class are considerably higher than what was on offer in the previous decade. As investors look to protect against the downside rather than speculate on the upside of equities, this note highlights a few key reasons why it could be high time for more high yield:
Reducing Portfolio Beta
Figure 2. Lower Drawdowns – from the ’01 dotcom bubble to ’25 tariff turmoil
Significantly lower drawdowns are not a new feature of the market, HY bonds have exhibited this feature over the last 25 years and beyond.
When high yield falls, equities typically get hit harder
High yield average drawdown is -12.9% compared to -20.7% for global equities
Problems loading this infographic? - Please click here
Source: ICE BofA and Bloomberg as at 28 April 2025. Data based on ICE BofA Global High Yield Index (HW00 Index) and the MSCI World Index.
Compared to equities, the income component of high-yield bonds' total return is typically larger, providing added stability and making their returns less volatile. Even in periods of market stress high yield bonds tend to recover quickly. They often exhibit a strong pull to par, so while their prices may fall, the short time to redemption at par will to some extent limit the deviation, reducing the drawdown time. Adding a further layer of security is the fact high yield bonds are higher in the capital structure than equity. This potential for recovery can make them an attractive option for investors looking to capitalize on market dislocations.
Figure 3. Swifter Rebounds
High yield has offered quicker recoveries than equity markets
Average recovery of 16 months from each peak* compared to 24 months for global equities
Problems loading this infographic? - Please click here
Source: ICE BofA as at 28 April 2025. Data based on ICE BofA Global High Yield Index (HW00 Index). *Average recovery excluding most recent March/April 2025 drawdown. **Recovery to date 28 April 2025.
Consistent Income
Turning our attention now to perhaps the most prominent feature of the asset class, income, we observe that bond running yields are outstripping dividend yields available in the equity market.
Figure 4. High Yield has offered better income than equity markets
Fixed coupons and higher rate backdrop provide more attractive income compared to equity dividend yields
Problems loading this infographic? - Please click here
Source: Bloomberg as at 28 April 2025. Indices utilized include MSCI World Index and Bloomberg Global High Yield Index.
Credit and default risk are often at the forefront of investors’ minds when deciding to purchase high yield bonds. However, they may not be aware of two key mitigants. Firstly, the overall credit quality of the high yield market has improved considerably over the last twenty-five years. At the start of the millennium, only 35% of the market was rated BB (the highest sub-investment grade credit rating), today this figure is closer to 60%. Secondly, the credit spread of the market (the additional risk premia provided for investing in corporate bonds) often overestimates the expected level of defaults priced into the market and therefore overcompensates investors when compared to actual levels of defaults experience in the asset class.
Figure 5. Implied defaults priced into spreads have often been worse than reality
Problems loading this infographic? - Please click here
Source: Bloomberg and ICE as at 28 April 2025.
Is the timing right?
Historically high underlying yields have been a good predictor of forward returns and the current Yield to Worst (YTW) for the ICE BofA Global High Yield Index is c.7.25%.
Figure 6. Yields can be a good predictor of forward returns
High underlying yields has historically provided a good barometer for 5 year forward annualised returns
Problems loading this infographic? - Please click here
Source: ICE BofA as at 28 April 2025. Data based on ICE BofA Global High Yield Index (HW00 Index). Returns are calculated 5 year forward from dates listed and shown gross of fees and expenses.
However, exact market timing may not be required as since 1999 the compound annual growth rate (CAGR) over all time periods has been positive. Even if one invested at the worst possible times like 2008 and 2022, you would still be sitting on positive returns by the next year.
Figure 7. CAGR since 1999 – historically timing has not mattered
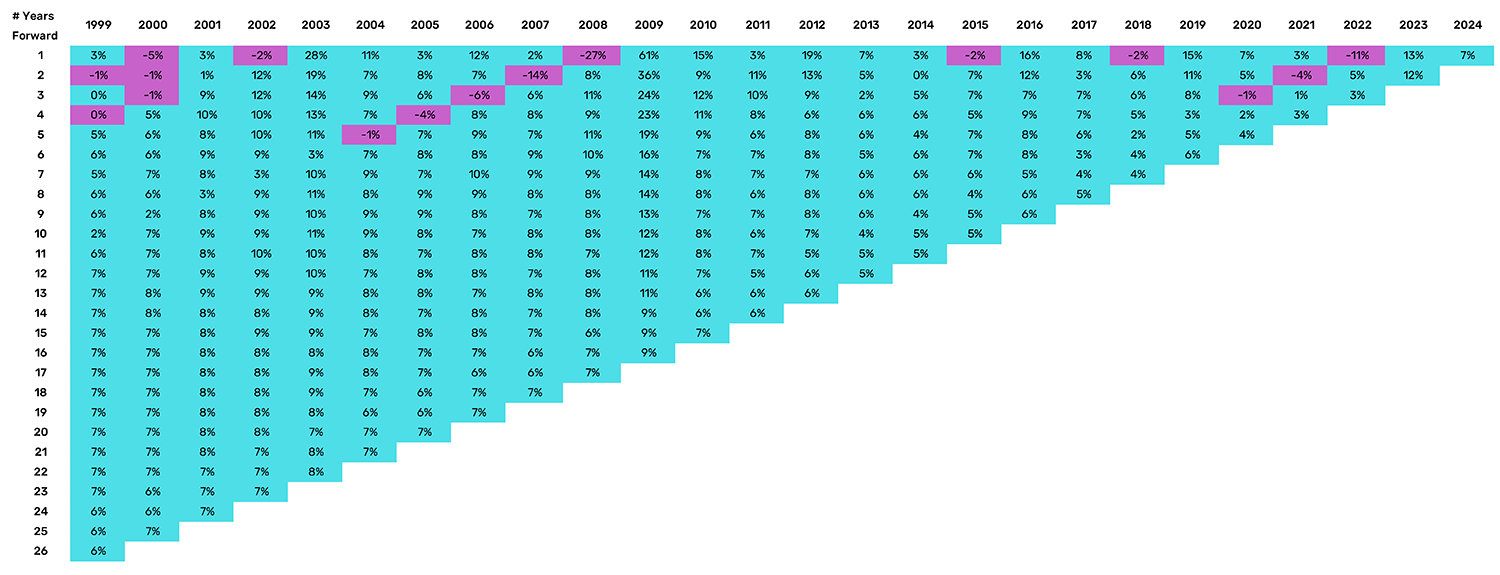
Source: ICE BofA as at 31 December 2024. Data based on ICE BofA Global High Yield Index (HW00 Index). The chart shows the annualised returns for high yield given the starting point for investments on the x axis and the years forward on the y axis.
In conclusion
Whilst trade wars have made investors re-consider their equity positioning, we believe the consistent nature of high yield, demonstrated by the long term trends in this piece, position the asset class as an alternative. Whilst equity markets may have higher upside; high yield can offer lower drawdowns, swifter rebounds, solid income and improving credit quality. On a risk adjusted basis, high yield bonds have offered more than double the return per unit of risk than equities.
Figure 8. When it comes to risk-adjusted returns, High Yield holds its own
20-year total return p.a. and risk adjusted return
Problems loading this infographic? - Please click here
Source: ICE BofA as at 28 April 2025. Data based on ICE BofA Global High Yield Index (HW00 Index). Returns are calculated 5 year forward from dates listed and shown gross of fees and expenses.

You are now leaving Man Group’s website
You are leaving Man Group’s website and entering a third-party website that is not controlled, maintained, or monitored by Man Group. Man Group is not responsible for the content or availability of the third-party website. By leaving Man Group’s website, you will be subject to the third-party website’s terms, policies and/or notices, including those related to privacy and security, as applicable.