As Christmas approaches, we have taken inspiration from the old carol and selected seven ‘black swans’ that could have an outsized effect on markets over the coming years, for both good and ill.
As Christmas approaches, we have taken inspiration from the old carol and selected seven ‘black swans’ that could have an outsized effect on markets over the coming years, for both good and ill.
December 2021
Writing an end-of-year article is often one of our more difficult tasks. There is very little utility in making a series of bold predictions that turn out to be completely wrong. Sometimes it would be nice to take a leaf out of J. P. Morgan’s book. When asked what markets would do, he replied “they will fluctuate”, and then went about his day.1
However, in 2022, Morgan may well be far closer to the mark than we would care to admit. In the aftermath of the Covid-19 pandemic, the global economy is more unstable than ever. On the one hand, the global stock of debt is at an unprecedented level. This makes it very difficult to achieve any kind of economic equilibrium. Portfolio management 101 is that leverage amplifies returns to the up and downside. Some leverage is usually judicious; huge amounts of leverage make for instability, something which is true at the portfolio, corporate and country level. On the other hand, the pandemic has unleashed a huge wave of stimulus, and accelerated digitalisation and innovation. Markets therefore face strong cross currents, both bullish and bearish. They may indeed fluctuate, and fluctuate wildly.
In this article, we ask what the catalysts could be that end up rocking the boat – and to which side. As Christmas approaches, we have taken inspiration from the old carol and selected seven ‘black swans’ that could have an outsized effect on markets over the coming years, for both good and ill.
1. Up Is Down: Inflation Is Deflationary
The first quarter of 2021 was all about the great reopening trade. The US 10-year yield peaked close to 1.8%. The rest of the year saw yields tread water to stand at 1.5% in early December. There has been much debate about the reasons behind such low yields when, month after month, inflation was higher than expected. Some argue that excess global savings and demographics explain the state of fixed income markets, others will argue the market is worried about recurring Covid variants coming in waves. Then there will be those that point to supply chain issues or US labour participation rate slowing down recovery. None of these explanations seems entirely satisfactory to us.
The Federal Reserve confessing that ‘transitory’ inflation has become ‘persistent’2 does not mean that we should be expecting runaway price increases. Instead, investors should consider the possibility that the effect of inflation will cause a large deflationary event. In our view, evidence to support this thesis can be found in the yield curve. On 30 November, when Fed Chair Jerome Powell indicated tapering may occur sooner rather than later, longer dated bonds did not sell off. On the contrary, yields on 30-year US Treasuries fell.
The price action demonstrates that most market participants don’t believe that the Fed tapering or raising rates will affect the value of long-duration assets. It is implausible to think that the Fed will not eventually become hawkish on inflation – it is rapidly doing so already. While they may have started the year as doves, central bankers are aware that untamed inflation is very hard to control and has the potential to be the source of great social unrest.
Any attempt to raise real rates will produce a very large financial shock somewhere, triggering an economic recession which, in turn, will kill off any inflationary pressure.
Instead, markets are taking the view that the stock of global debt is so large that the world economy cannot deal with higher rates. With more and more debt, the sensitivity of economic activity to rates becomes almost infinite. As such, investors don’t disbelieve the Fed. Instead, they foresee that any attempt to raise real rates will produce a very large financial shock somewhere, triggering an economic recession which, in turn, will kill off any inflationary pressure.
Why, then, sell long maturity US government debt? A 30-year US Treasury position might generate significant P&L in a new deflationary shock and provide a good hedge against losses incurred in risk positions in other parts of a portfolio. After all, German, Swiss or Japanese 30-year yield are negative or slightly positive already, but the US is still trading at 1.8%.
Figure 1. Change in the US Yield Curve – 30 November 2021
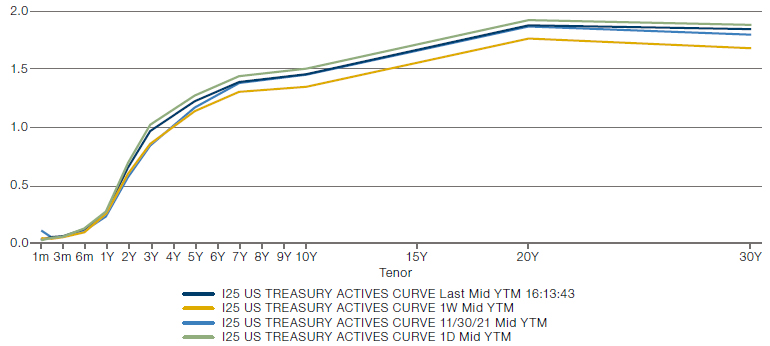
Source: Bloomberg; as of 30 November 2021.
2. Real Estate
Valued at USD326 trillion, the biggest asset class in the world is real estate. Indeed, it dwarfs the global GDP, which was estimated at USD85 trillion at the end of 2020 (Figure 2). Much like equity markets, the global housing market has soared, rising some 67% in real terms since 2000 (Figure 3). Such an increase has obviously been much higher than the increase in global output and rents during the same period (Figure 4). As we can see, the multiple has gone up 40 points in 10 years, and is now higher than it was in the US before the Global Financial Crisis in 2008.
Problems loading this infographic? - Please click here
Source: Savills Research; as of 31 December 2021.
Global real estate consists of commercial real estate, residential real estate and agricultural land.
Figure 3. Global IMF House Price Index
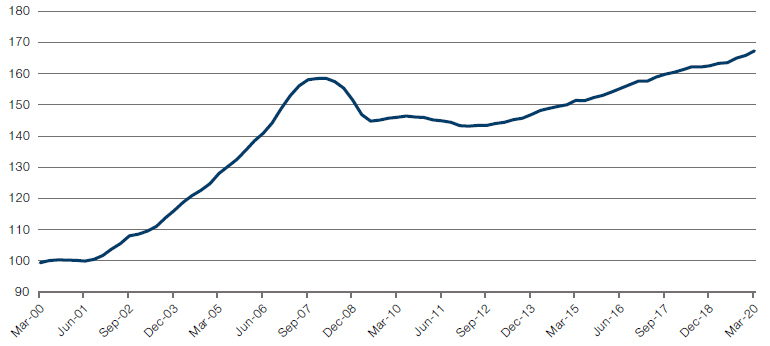
Source: Bloomberg; as of 6 December 2021.
Problems loading this infographic? - Please click here
Source: OECD; as of 10 December 2021.
Let’s assume that real estate prices fall by 10% – not a big ask given the magnitude of the increase in prices over the last decade. This would lead to the destruction of almost USD33 trillion of wealth – about a third of the 2020 global output.
This price growth has primarily been driven by a decade of low interest rates. If real rates move meaningfully up as a result of inflation and central banks hiking rates in response, real estate is the asset class that would represent the main risk to the global economy. While fewer borrowers are at risk of being unable to afford their repayments compared to the 2007-08 US housing crisis, many would end up in negative equity, creating a sizeable negative wealth effect.
Let’s assume that real estate prices fall by 10% – not a big ask given the magnitude of the increase in prices over the last decade. This would lead to the destruction of almost USD33 trillion of wealth – about a third of the 2020 global output. In comparison, the total wealth destruction for US households in 2008 was equivalent to USD11 trillion, a figure that includes losses in stocks and bonds. For comparison, US GDP in 2007 was USD14.45 trillion.
Such a crisis would develop at a time when China is experiencing severe difficulties of its own in the real estate sector, which has been a major force behind its economic performance and therefore behind the global economy. It is estimated that at the end of 2020, the Chinese property industry had 26 trillion Chinese yuan in interest-bearing debt and 85 trillion Chinese yuan in total liabilities (Figure 5). This is equivalent to 26% of Chinese GDP and 4.8% of global GDP in 2020. While measures have been taken to control the fallout, there are unsettling echoes of the US sub-prime crisis in the air: we were famously reassured by Ben Bernanke in May 2007 that “the effect of the troubles in the subprime sector on the broader housing market will be limited and we do not expect significant spillovers from the subprime market to the rest of the economy or to the financial system”.3 The People’s Bank of China has issued a similarly reassuring statement on 15 October indicating that the fallout from Evergrande was “controllable”.4
Figure 5. Liabilities of Chinese Property Sector
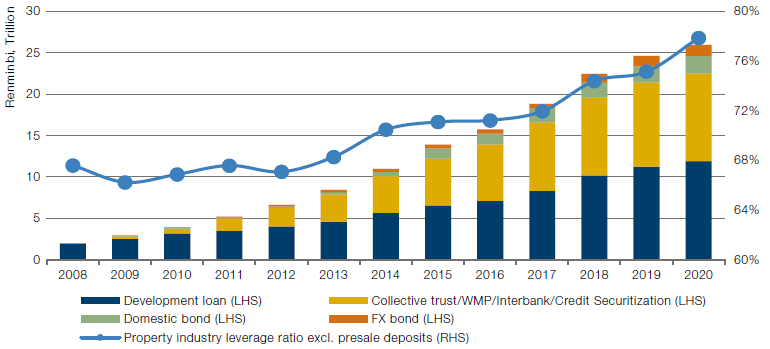
Source: Goldman Sachs; as of 31 December 2020.
One of the most surprising aspects of current markets is also one which gives us a positive outlook for equities in the short term: the elevated equity risk premium.
3. The Elevated Equity Risk Premium and the Possibility of a Further Melt Up
Not all black swans are portents of doom. One of the most surprising aspects of current markets is also one which gives us a positive outlook for equities in the short term: the elevated equity risk premium. Even though US CPI leapt to 6.2% year-on year in November, the US 5-year 5-year is still at 2.2% (Figure 6). This measure describes investor expectations of what the 5-year inflation rate will be in five years’ time, and is a good proxy for market expectations about the long-term direction of inflation. With the current 10-year yield in the US hovering around 1.5%, a conservative way to calculate the real 10-year yield is therefore -0.7%.
After a year of lost earnings in 2020, 2021 has seen an impressive rebound. In multiple terms, at a 21x blended forward price-to-earnings ratio, the S&P 500 Index is now cheaper than at the start of the year. This is because even though the index’s absolute price has risen, the increase in the denominator (i.e. higher earnings) have been even larger (Figure 7).
Problems loading this infographic? - Please click here
Source: Bloomberg; as of 30 November 2021.
Figure 7. S&P 500 Index Versus BEst PE Level
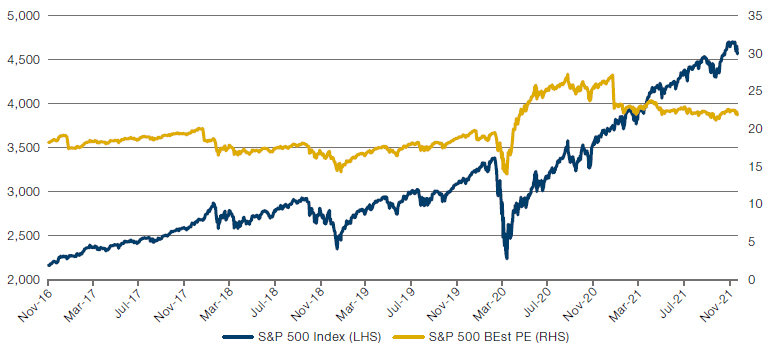
Source: Bloomberg; as of 30 November 2021.
Problems loading this infographic? - Please click here
Source: Goldman Sachs; as of 10 December 2021.
Every day that goes by without a correction in real rates is therefore an opportunity for the S&P 500 to go higher and the equity risk premium to converge towards its long-term average.
The US equity risk premium is therefore attractive relative to history, at around 5.4%. All other valuation metrics that can be used to measure how expensive or cheap equity markets look are in the 90-100% percentile. But every day that goes by without a correction in real rates is therefore an opportunity for the S&P 500 to go higher and the equity risk premium to converge towards its long-term average. However, this still leaves a lot of room for upside: for the equity risk premium to converge towards its long-term average, the S&P 500 would have to post a highly unexpected positive performance in 2022, exceeding the target of the most bullish strategists by a large margin. Real rates could, of course, rise and compress the premium from below. However, if they move only with an increase in GDP growth expectations, there is still a significant upside. Another way to look at the situation with the S&P 500 is in terms of dividend yield. While the current dividend yield on the S&P 500 is the same as it was in 2000, the 10-year nominal US rate was 6.5% in 2000 versus 1.5% today (Figure 9).
Problems loading this infographic? - Please click here
Source: Bloomberg; as of 3 December 2021.
What makes such a melt-up possible is the enormous inflows into equity markets. Corporates are currently buying their own stocks at record pace5, arbitraging the cheap cost of debt against the high equity risk premium, which in turn increases their earnings per share. The probability of the equity risk premium reverting towards the mean is also increased by the bullishness of retail rather than institutional investors. Institutional cash levels are elevated, and are at the highest levels since 2013 in absolute terms, indicating significant dry powder to buy into the equity market (Figure 10). In addition, retail investors have much more disposable cash than before as a result of Covid-induced excess saving. This was in part driven by exceptionally generous unemployment benefits and stimulus cheques. As a consequence, they have been piling into global equity ETFs and mutual funds, with the inflows this year exceeding the cumulative inflows of the previous 20 years.6
Indeed, no one could blame them. When inflation is outstripping bond returns, retail investors and companies have the choice of losing money in cash, losing money in bonds or taking exposure to the riskiest asset class, equities. Indeed, with real rates so low, we effectively have the return of TINA. And when TINA is in town, we may well see a further equity melt up – for what else is there for people to do with their money?
Figure 10. Institutional Cash Levels
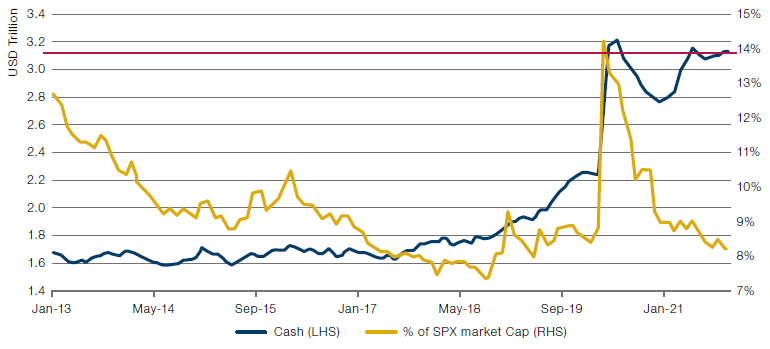
Source: UBS; as of 4 November 2021.
One of the most important facets of the Covid-19 pandemic was the pace at which it drove innovation.
4. Start-Ups and Endogenous Growth
One of the most important facets of the Covid-19 pandemic was the pace at which it drove innovation. It has become passé to assert that 10 years’ worth of digitalisation took place within two. As soon as the pandemic hit, the quality of a business’s online offering became crucial to its success. Consumers who had previously never shopped online began to do so in vast numbers, and the stock price of online retailers soared accordingly. However, innovation was not simply confined to grandmothers discovering how to use the internet for the first time. The pandemic drove meaningful productivity gains, as employees working from home delivered similar amounts of work in reduced hours.
In addition to being a positive productivity shock in its own right, the pandemic has combined with our previous black swan – the elevated equity risk premium – to offer the possibility of more prolonged productivity gains. With negative real rates and equity markets very expensive on a multiples basis, investors looked away from traditional assets like stocks and bonds, allocating money to venture capital and start-ups as never before (Figure 11).
Problems loading this infographic? - Please click here
Source: Preqin; as of March 2021.
One important area is nuclear fusion research, with start-ups raising record funds.7 If successful, nuclear fusion has the potential to produce almost limitless energy – which would neatly solve many of the energy supply issues associated with the transition away from fossil fuels. Scientists are yet to conduct a fusion reaction which produces more energy than it consumes. But there is a growing belief that after more than 60 years of research, a net energy producing fusion reaction could be with us as early as 2024. It is not hard to imagine how such a breakthrough might transform our world.
In fairness, nuclear fusion is so well covered that it can hardly be described as a black swan. But it illustrates a useful point: the vast flow of funds to start ups will almost certainly create new businesses that will spur further innovation and productivity gains. Under the endogenous growth theory, economic growth is the result of investments in technological improvement, innovation, knowledge deepening and human capital. Just as few could foresee how the founding of Facebook and transform the global advertising landscape, we have no idea exactly what form this innovation will take. But such an investment is likely to produce at least one singularity, a technological change which redefines the economic and investment landscape.
The question is now whether cryptocurrencies are like tulips. Tulips still exist and are useful – but should the price be USD 60,000 or USD 6?
5. Cryptocurrencies
Bitcoin, the largest and best-known of the cryptocurrencies, has had an odd ride. More than USD50 billion worth of the cryptocurrency is traded every day according to Goldman Sachs – a higher volume than Amazon, and a sure sign that the asset class is here to stay, at least over the medium term. As with the stock market, the lack of returns available to normal savings has led ordinary people to channel excess cash towards cryptocurrencies in the hope of returns. The question is now whether cryptocurrencies are like tulips. Tulips still exist and are useful – but should the price be USD 60,000 or USD 6?
As we’ve previously written , the bitcoin bubble is unique compared to previous speculative excesses. Even though the bubble has deflated repeatedly, it has respawned in Promethean fashion. Price collapses, such as an eye-watering fall from USD60,000 in April to USD30,000 in June, have been followed by recoveries (Figure 12). These falls haven’t been accompanied by the instability that we would normally expect when an asset class drops by 50%. The asset class is rumoured to be dominated by a small number of individuals with large holdings, but it is clear from price action that the level of leverage in the crypto market is growing.
Markets dominated by a small number of investors tend to be more volatile than those with wide participation. However, bitcoin volatility remains high even as more participants enter the market. Retail bitcoin traders have always traded exceptionally frequently. However, the volatility can also be explained by an increase in leverage, with margin positions being forced to sell whenever the market drops.
Problems loading this infographic? - Please click here
Source: Bloomberg; as of 30 November 2021.
In our view, the greatest threat to bitcoin and other cryptocurrencies would be the widespread introduction of leverage into the market. Already, more and more trading platforms are offering retail traders leverage. Indeed, the biggest cryptocurrency collapse has been partly blamed onto forced selling via by retail traders.8
Our point about real rates also applies to cryptocurrencies. Bitcoin speculation becomes much less attractive when there is a higher cost of capital. Likewise, if inflation increases the cost of living, there may well be a strong temptation for retail investors to raise cash by selling their bitcoin holdings. Previous bitcoin collapses have been harmless: all that was wiped out was equity. Once leverage enters the equation, the consequences can become more severe. This is all the more true given that the retail traders who make up crypto trading volumes are also driving equity flows. It would not surprise us if both markets trended together in a crisis, with retail traders liquidating all holdings to provide ready cash.
6. Covid and Europe: Elevated Risk, Elevated Rewards?
The pandemic has also created another black swan in Europe, the effects of which are yet to become clear.
In some ways, the effect of the pandemic has been positive. To provide stimulus, the European Union has enacted fiscal transfers for the first time via its NextGenerationEU bailout package. Its 2021-2027 budget likewise splurges the cash, with EUR1.8 trillion earmarked for spending.9 This has gone some way to reducing political risk in the bloc: with so much money to hand out, formerly Eurosceptic politicians have muted their criticisms and even joined coalition governments (as in the case of Italy) in the anticipation of being able to spend some of this largesse.
The experience of Brexit has made the display of any Eurosceptic sentiment simply posturing. Very few European politicians seriously wish to countenance leaving the bloc, especially since the most Eurosceptic politicians hail from countries such as Poland and Hungary, which have been the biggest beneficiaries of EU membership in terms of spending. With this massive spending entirely underwritten by the German taxpayer and the support of the European Central Bank, this is a sweet spot for European bulls, as fiscal transfers reduce the perceived structural risk in the bloc.
Rising debt levels should be our primary concern.
Instead, rising debt levels should be our primary concern. The quantity of French government debt has steepled both in real terms and as a percentage of GDP. In absolute terms, French government debt has overtaken Italy’s this year. Furthermore, more than 50% of French debt is held by foreigners, while the Italian government bonds (‘BTP’) are now mostly owned by either the Bank of Italy or Italian banks. Arguably the French government bonds (‘OAT’) is now the second-most traded fixed income asset in the world after US Treasuries.10 What is disturbing is that the debt mountain is supported by a relatively tiny private sector: the French state accounts for close to 60% of French GDP, the highest in the OECD (Figure 13). The size of the private sector ultimately supporting government debt is therefore much smaller than in other debtladen countries.
Politically, the current Italian Prime Minister Mario Draghi is a Eurocrat to his core: the former President of the ECB and the man who said he would do “whatever it takes” to defend the euro.11 However, he is favourite to replace the current President of Italy in January 2022. Who would replace him as Prime Minster would be moot – the competition to become the new Prime Minister might end the current relative consensus in Italy and reignite market worries about the path of the Italian debt. France is facing its own political uncertainty in May 2022 with President Emmanuel Macron being up for re-election. This election is highly uncertain with currently four candidates in a position to reach the second round.
While the ECB continues to buy any debt member states issue, these worries might not be enough to start the next euro crisis. But if European inflation persists, the ECB will be faced with a choice: continue to stoke inflation with more quantitative easing, something German voters might find unacceptable, or see what the true market price of French (or Italian, or indeed most southern European countries) debt should be. In this scenario, French debt is most at risk. All government debt is effectively a call option on future tax revenues. Of all major economies, the French tax base is the one that is most precarious. And while it can weather the storm for as long as ECB continues to buy bonds, if QE stops, investors may well decide to sell.
Problems loading this infographic? - Please click here
Source: OECD; as of November 2021.
This trend is not only confined to member states. The UK has debt levels unsurpassed since World War II, and runs both a current account and budget deficit of 2% and 10% of GDP, respectively. GDP numbers have stopped rebounding quite so quickly, causing the Bank of England to hold rates in its November Monetary Policy Committee meeting. With UK inflation numbers remaining high at 4.2%, it will be interesting to see what the MPC will decide at its monetary policy meeting on 16 December. The UK cannot suffer a debt crisis in the way that could befall France, as it controls its own money creation. Instead, the risk is to the pound rather than gilts. Increasing the cost of labour in an already inflationary period runs the risk of stagflation if we do not see a rise in growth. Brexit has massively tilted the balance of power to the labour force as it has restricted the access of foreign workers to the UK labour market. In that sense, the combination of this unique labour supply shock globally, combined with the current supply chain issues, puts the UK in a particularly risky situation.
Having said that, Brexit does give the UK the opportunity to massively outperform. Since the 18th century, the UK has always had a highly financialised economy compared with its neighbours. It is already a haven for international investment, notably in its property sector. Outside the EU, it has the chance to tweak its regulatory regime to maximise its overriding advantage in services. We are already seeing the fruit of its relative competitiveness: two major dual-listed companies, Unilever and Royal Dutch Shell, have now decided to become solely British-based entities. A 15% dividend withholding tax applied in the Netherlands was a key reason for the decision. Nevertheless, it must not miss the opportunity to reinforce its status as a businessfriendly economy.
Europe is ripe for a black swan – but who knows whether it will be for good or ill?
Europe has always been a high beta play on global growth. However, at this point in time, the risks and rewards on the continent are much higher than normal. The pandemic and its consequential fiscal transfers have left the bloc more unified, but more fragile, than ever. The UK runs possibly the highest stagflation risk in the developed world, yet has an unapparelled opportunity for growth. Europe is ripe for a black swan – but who knows whether it will be for good or ill?
Problems loading this infographic? - Please click here
Source: OECD; as of November 2021.
7. The End of the Private Equity Bubble
The last black swan is private equity.
Why does one invest in private equity? After all, average PE returns are now barely above public equity returns, with the added cost of higher fees (Figure 15).
Figure 15. Three-Year Private Equity Returns Minus Public Equity Returns
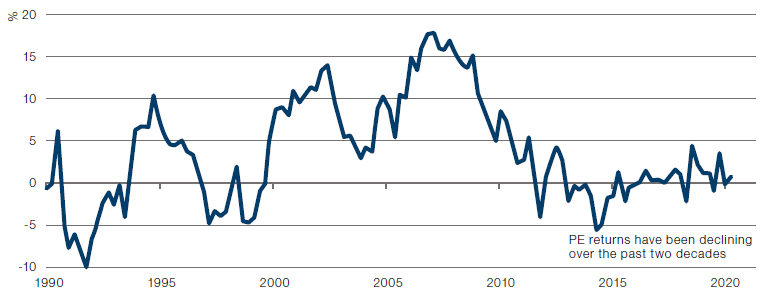
Source: BCA; as of 31 December 2020.
Note: Public equity is MSCI World. Private equity is the Cambridge Associates LLC US Private Equity Index®, a horizon calculation based on data compiled from 1,468 US private equity funds (buyout, growth equity, private equity energy and subordinated capital funds), including fully liquidated partnerships.
By selling to each other, they can set their own valuations without outside influence. If valuations remain high, PE firms can still receive carried interest for good performance. This suits everyone concerned, except ultimately the general public.
It is only when we examine what happens when equity markets fall that the attraction of private equity becomes clear. Because they are so rarely marked to market, private equity-type structures have become a convenient way for investors to avoid the volatility inherent in the price discovery of public markets. When something seems too good to be true, it usually is. As we’ve previously written, PE funds now largely duck the scrutiny of the IPO or strategic markets, and instead sell a large share of their holdings to each other. This almost oligopolistic set-up suits the PE funds: by selling to each other, they can set their own valuations without outside influence. If valuations remain high, PE firms can still receive carried interest for good performance. This suits everyone concerned, except ultimately the general public. As more and more institutional investors allocate to PE, more and more companies exit the public market, reserving equity gains for a privileged few.
Problems loading this infographic? - Please click here
Source: Preqin; as of March 2021.
More worryingly, at some point there will be a reckoning. The game of pass-the-parcel can go on only if inflows carry on at the current pace. As flows have been accelerating, we are yet to hit a problem. Having said that, as clients commit capital to new funds and deploy the cash over time, there is a risk many have over-committed, counting on capital from previous funds being distributed in the meantime. A liquidity shock to credit markets could end the party for the asset class. Most have by now forgotten the liquidity issues the asset class encountered in 2008-9, with many distressed limited partners selling existing commitments at steep valuation discounts in the market. A large secondary market has grown since which could absorb some of the over commitments. However, even that market is subject to the same dynamic as its underlying asset class. The fact the IPO market would most probably be shut during such liquidity crisis increases the constraints the asset class would face. Such a negative development would have severe consequences for other markets that offer more liquidity as market participants look to raise their liquidity profile.
Conclusion
It is the nature of black swans that they escape notice until it is too late. We therefore expect that the article will provide more food for thought than testable predictions. Nevertheless, markets are at a crossroads, and investors should think hard about what events may have an outsized effect in the future.
So there, we have it: seven possible black swans, four of which could rock markets, two that could raise them, and one that might go either way.
It is clear a common feature of the potential negative tail risk we have considered relate to a liquidity shock resulting from a steep increase in real rates. It seems crucial to us to keep a very close eye on that market price. Some of these tail risks have such severe consequences for markets and social stability that it is likely they would meet very strong response from central banks… again. In an age of massive debt loads, an inflation shock is so deflationary that it is almost self-defeating.
So there, we have it: seven possible black swans, four of which could rock markets, two that could raise them, and one that might go either way. And on that note, we wish you a very merry Christmas and happy New year – and the best of luck for 2022.
1. Source: Business Insider; 6 memorable leadership lessons from the financial giant J.P. Morgan; 17 October 2016.
2. Source: MarketWatch; “Powell says Fed may end its asset purchases a few months early”; 30 November 2021.
3. CNBC; “Bernanke: Subprime Mortgage Woes Won’t Seriously Hurt Economy”; 17 May 2007.
4. Reuters; “China cbank official says spillover effect of Evergrande’s debt woes is controllable”; 15 October 2021.
5. https://www.reuters.com/business/cop/us-stock-buybacks-head-record-third-quarter-2021-11-02/
6. Source: Goldman Sachs.
7. Source: Financial Times; “Record Fundraising by a Nuclear Fusion Start-Up”; 5 November 2021.
8. Source: CNBC; “Bitcoin traders using up to 100-to-1 leverage are driving the wild swings in cryptocurrencies”; 25 May 2021.
9. https://ec.europa.eu/commission/presscorner/detail/en/IP_20_2073
10. Bloomberg.
11. https://www.ecb.europa.eu/press/key/date/2012/html/sp120726.en.html
You are now exiting our website
Please be aware that you are now exiting the Man Institute | Man Group website. Links to our social media pages are provided only as a reference and courtesy to our users. Man Institute | Man Group has no control over such pages, does not recommend or endorse any opinions or non-Man Institute | Man Group related information or content of such sites and makes no warranties as to their content. Man Institute | Man Group assumes no liability for non Man Institute | Man Group related information contained in social media pages. Please note that the social media sites may have different terms of use, privacy and/or security policy from Man Institute | Man Group.