The markets have experienced an unprecedented period of volatility. What does this mean for the liquidity of public equity markets and how long can PE carry on dodging the lime-light?
The markets have experienced an unprecedented period of volatility. What does this mean for the liquidity of public equity markets and how long can PE carry on dodging the lime-light?
April 2020
Introduction
When, at the tail end of the last millennium, Francis Fukuyama wrote about the “end of history”, it was as if history immediately decided to show him what it could do, unleashing everything from 9/11 to Brexit to multiple euro crises. Now, just as it was beginning to seem as if the bull run would go on forever, it’s as if the bear market is trying to make up for lost time.
It’s been a little over a month since the S&P500 Index hit its highest level in history and the size and swiftness of the retrenchment since then has been extraordinary. In a time of enormous volatility, we take a look at the dynamics of liquidity, thinking about how the present moment has been influenced by regulatory responses to the Global Financial Crisis (‘GFC’). We also recognise that the liquidity dislocations observed in the public markets are probably a reflection of much more serious problems for the private markets. As such, we believe that private equity is likely to come under increasing focus as the COVID-crisis plays out.
The End of History
Often over the last year, we wrote repeatedly that investors needed to prepare themselves for the end of the bull market, and that the end – when it came – was likely to be swift and brutal. However, we admit that we never foresaw something like this. That’s the thing about black swan events, though: by their very nature they blindside everyone. Indeed, while we are only weeks into the current bear market, the speed and sharpness of the decline outpaces even 1929 (Figure 1). Indeed, USD27 trillion has been wiped off global equity prices – equal more or less to the combined GDPs of the euro area and China.
Historical days indeed!
What is different this time around, of course, is the size, speed and concerted global nature of the governmental response to the crisis. Policymakers these days are well-trained …
Figure 1. Bear Markets Over Time
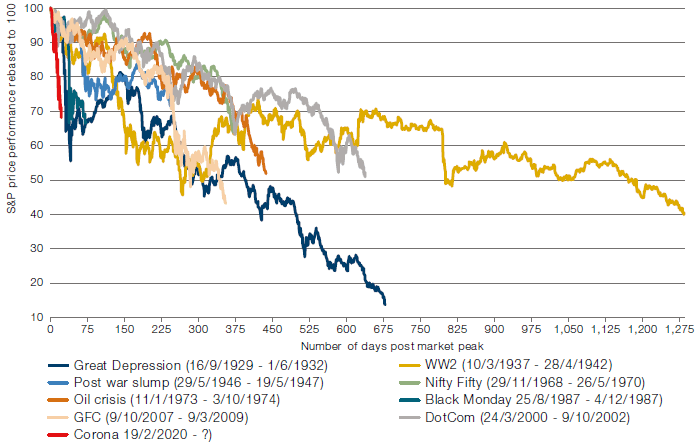
Source: Bloomberg; as of 31 March 2020.
We might make a small digression here to point out that people tend to reach back – first to Black Monday and 1987, then directly to the Great Depression – when looking to establish precedents for the current volatility.
The 1970s appear forgotten altogether. Yet, UK equities fell more than 70%1 over the course of two years at the start of the decade, following the end of the Bretton-Woods system, a localised housing-driven recession and the global oil crisis. In many ways, the early ’70s provide a better template for what we’re currently living through than the more commonly-cited historical crashes – and we’d draw your attention to what happened to inflation subsequently.
A Look at Liquidity
One of the things we worried about as this most recent panic took hold was liquidity: we know that dealers become more conservative at times of uncertainty, and that nothing fuels uncertainty like the breaking of routines. The disruption and technological challenges we’ve all endured over recent weeks have been magnified immeasurably for those dealers for whom success or failure lies in the spread they can make on securities whose prices are less certain with every passing day.
What’s more, this virus conflates personal and professional worries in a way that is hugely problematic psychologically – how do traders separate their very human concerns for their own health and that of their families from their broader sense of the likely impact of the crisis on earnings and sentiment? The answer is that they can’t, and this is another factor that will weigh on dealers’ willingness to saddle risk.
The rout has essentially seen two distinct phases so far: an initial, orderly unwind followed by a period of panic as the virus took hold in Europe and the oil price war added fuel to the fire. During the initial deleveraging, the equity markets saw huge volumes as systematic strategies took off risk and a mixture of institutional and retail money stepped in to plug the gap.
As we moved from retrenchment to capitulation, though, liquidity began to dry up, with banks coming to recognise that their capital positions would come under threat if they allowed their balance sheets to become bloated with inventory. It’s striking that regulators in Europe have decided not to implement 2020 stress tests for their banks, recognising that requiring adherence to strict post-GFC rules would both dissuade dealers from continuing to support the orderly functioning of the markets and potentially further spook an already panicked investor base. With equity markets still whipsawing – in March we experienced both the steepest decline and most significant rally since the Great Depression – we believe it is likely that liquidity will continue to be a challenge as we move through this crisis.
Figure 2 provides an interesting breakdown of dealer activity during recent weeks, showing the decline of dark venues and the rise of LIT trading2 – effectively illustrating a diminishing willingness for dealers to take on risk as the rout played out. LIT pools show bid/offer pricing for the stocks they trade, while dark venues do not. Dealers tend to step back from dark liquidity at times of market stress.
Figure 2. Daily Venue Distribution of the EuroStoxx 600 (2020)
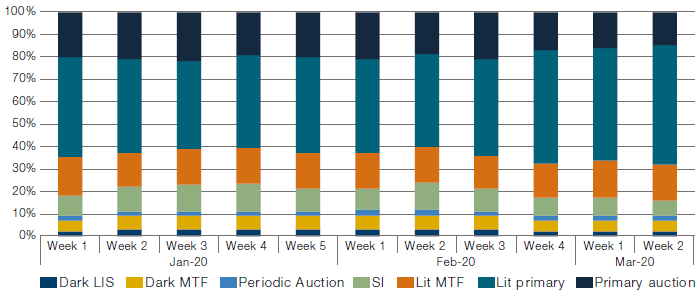
Source: Reuters; as of 17 March 2020. Note: Displayed includes primary and LIT MTF volumes, including only the LIT MTFs (BATS Europe, Aquis Chi-X and Turquoise). The data set only includes LIS venues (BATS, Liquidnet and Turquoise) that Goldman Sachs connects to. SI data captures flow reported on the BATS/Chi-X OTC Reporting tape excluding technical trades.
Dealers have been caught between the Scylla of massive investor deleveraging and the Charybdis of capital constraints that are enforced by risk committees far stricter than prior to the GFC. The response has been to widen spreads (often by double-digit multiples) or to back off from the market altogether, at least when it comes to securities where there is any kind of question about the possibility of ongoing liquidity. As an example, Figure 3 shows the gapping out of the bid-offer spread in the EuroStoxx 600.
Figure 3. Widening of Bid-Offer Spread
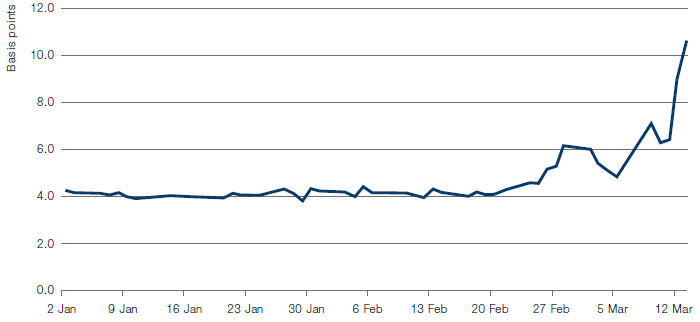
Source: Reuters; as of 17 March 2020.
A Reckoning of Private Equity?
Still, we believe that the stress in visible markets is likely to be only a fraction of that being suffered by historically more opaque, illiquid instruments. The ‘hot potato’ nature of private equity (‘PE’) make us nervous and it may be that this latest crisis finally precipitates a reckoning in a market that has for too long been running on fumes. The private equity industry appears in robust health, having raised a near-record USD919 billion in 2019 and with more than USD2 trillion in undeployed capital.3 Private equity does not suffer mark-to-market pressure, and asset valuations are largely down to the discretion of the asset owners. As an example, when Southland Energy went into bankruptcy earlier this year, its owner Encap noted in a filing that it had written down the value of its investment by 25% in early 2019. This left the company valued at almost precisely what Encap had paid for the firm: more than USD750 million. The investment was then written down to zero.4
It’s an example of the fact that private equity is more often mark-to-myth than mark-to-market, a situation that is sustainable as long as funds are able to flip companies between them, applying ever more leverage – in 2019, average leverage in leverage buyouts (‘LBOs’) exceeded pre-GFC levels for the first time.5 The passing of problem companies from one PE firm to another has become endemic in the industry, with 40% of all deals in 2017 being secondary transactions (against a 12-year average of 29%).6
It may be that, notwithstanding the dry powder available, the coronavirus-related seizing up of the markets means that the appetite for debt diminishes dramatically. With the likelihood of a raft of downgrades and a spike in defaults, and with traditional buyers of LBO debt – collateralised loan obligations (‘CLOs’) and bond ETFs – absent or substantially constrained, it’s unclear how private equity houses will be able to refinance the deals whose debt comes due in the coming months, and the spate of secondary deals may grind to a halt.
We tried to get an idea of where private equity valuations would price if they traded in a public market by looking at the performance of listed private loan companies. These firms, sponsored by some of the biggest names in private equity, make loans to middle-market enterprises. It’s no surprise that their shares have traded off dramatically, given the illiquidity and potential credit concerns of their underlying assets (Figure 4). It may be that they give an early warning indication of the problems that the entire private equity industry will face in the coming months.
Certainly, for deals to get done, they will need to be structured with greater equity contribution from sponsors and more protection for debtors in loan covenants. Where this leaves companies that have been limping along with excessive leverage and cov-lite documents is unclear.
Figure 4. The Public Face of Private Loans
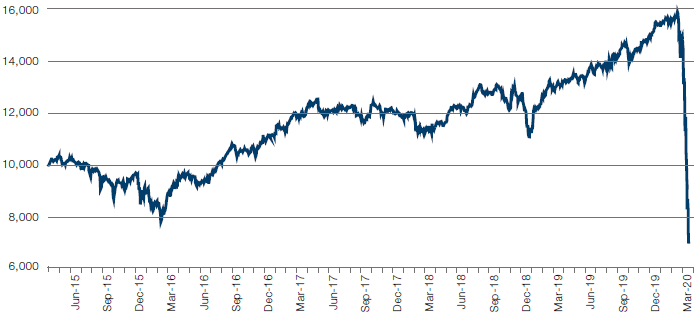
Source: Bloomberg; as of 24 March 2020. Note: The index is comprised of Ares Capital, Apollo Investments, FS KKR and TPS Speciality Lending in equal proportion.
Conclusion
We believe liquidity will continue to be an issue for all markets as we move through the coronacrisis. However, it may well be that the most significant problems are brewing out of sight. Eventually, private equity firms will need to let the light in on their assets, many of which we believe to be marked well above anything approaching fair value. For the moment, keep an eye on publicly-listed loan funds – the only visible signs of the chaos to come.
1. Source: BBC News, Reading the Stock Market, 6 May 2003.
2. A LIT or light pool market will allow traders to see the amount of liquidity that is posted on the bid and offer of the order book for a security.
3. Source: PrivateEquityWire; Private markets have seen an impressive decade of growth, says McKinsey report; 24 February 2020.
4. Source: FT; Private equity and the mark-to-market myth; 28 January 2020.
5. Source: S&P Global Market Intelligence; LBO purchase price multiples hit record high as PE shops dig deeper for equity; 15 November 2019.
6. Source: Goldman Sachs.
You are now exiting our website
Please be aware that you are now exiting the Man Institute | Man Group website. Links to our social media pages are provided only as a reference and courtesy to our users. Man Institute | Man Group has no control over such pages, does not recommend or endorse any opinions or non-Man Institute | Man Group related information or content of such sites and makes no warranties as to their content. Man Institute | Man Group assumes no liability for non Man Institute | Man Group related information contained in social media pages. Please note that the social media sites may have different terms of use, privacy and/or security policy from Man Institute | Man Group.