Reasons why we still have a defensive stance on emerging-market debt: current account performance in EM, the crowding out factor and US inflation.
Reasons why we still have a defensive stance on emerging-market debt: current account performance in EM, the crowding out factor and US inflation.
November 2019

Introduction
In March, we wrote about why we were remaining defensive on emerging-market (‘EM’) debt in light of the Federal Reserve’s balance-sheet changes. At the time, we stated that we were very negative on the outlook for both the hard currency and local currency indexes as a consequence of a combination of the following factors:
- Poor current account performance given the ‘cheap’ valuation of EM currencies due to a combination of a structural deterioration in the terms of trade (prices for EM countries exports) and in the credit metrics of these countries since the global financial crisis;
- Our expectation that the increase in the net supply of high quality government bonds to be absorbed by private market participants will crowd out the demand for assets that have been substitute for Treasuries, high quality European government bonds, and Japanese government bonds (‘JGBs’) on the margin. This would in turn force further real exchange depreciation across EM economics to compensate for the decrease in capital flows going to substitute assets;
- Our expectation that inflation in the US will accelerate, which in turn will force the Fed to go back into tightening mode, in a context where market participants price cuts going forward.
In this article, we address each of the factors given the developments since March. In a nutshell, our defensive view still stands.
Factor 1: Current Account Performance
Since March, current account balances have continued to be weak and in deficit despite the fact that EM currencies have weakened, both from a real exchange-rate perspective and nominally against the US dollar (Figures 1, 2).
Figure 1. Current Account/GDP Ratios for JPM GBI-EM Components Versus the Real Exchange Rate
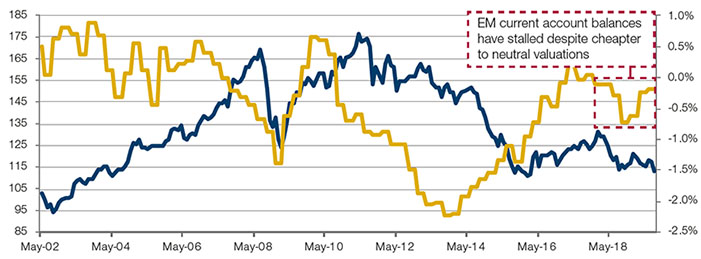
Source: Bloomberg, Man GLG database; as of 3 October 2019.
As Figure 2 shows, the currency component of the EM local bond index is 0.35% weaker year-to-date and 2.47% weaker since we published our previous note.
Problems loading this infographic? - Please click here
Source: Bloomberg; as of 25 October 2019.
More importantly, the growth differentials between EM and developed markets (‘DM’) have almost disappeared. Indeed, the investment growth differentials – that would drive the external account performance of EM countries – have not just converged, but gone negative for the EM economies (Figures 3, 4).
Figure 3. Real GDP Growth
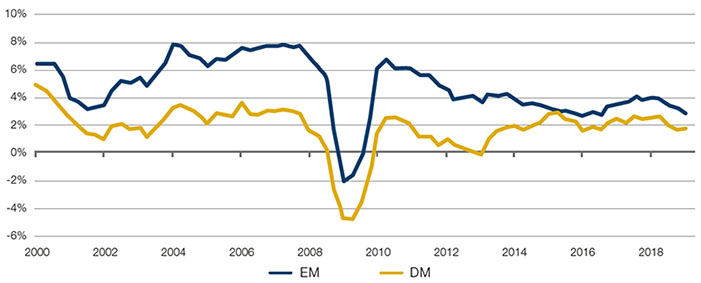
Source: Emerging Advisors Group; as of 2 August 2019.
Figure 4. Investment Growth
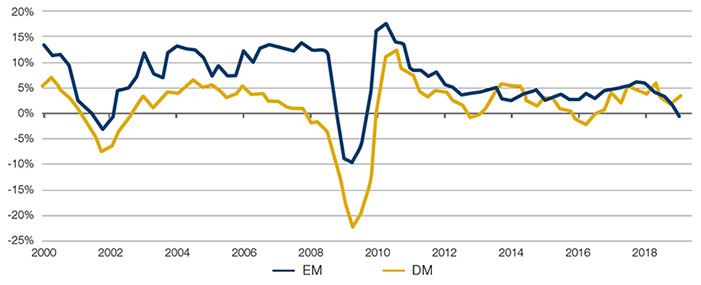
Source: Emerging Advisors Group; as of 2 August 2019.
So, it is our view that that fundamentals for the asset class are the worst they have been since the early 2000s, and the dynamics of investment and GDP growth look eerily similar to what we saw back then.
Factor 2: Crowding Out Demand for High-Quality Substitute Assets
Between late March and mid-August, the Treasury supply was close to zero because the US Treasury could not issue net new debt as a consequence of the constraint imposed by the debt ceiling (Figure 5). This was the main driver, in our view, for the fall in US Treasury yields between late April and early August (Figure 6).
Only in mid-August (after the debt ceiling rollover was approved) did the US Treasury restart its issuance activity in meaningful size. We believe this was the main reason for the funding stresses experienced by money markets in the US in mid-September, requiring an emergency response by the Fed, which restarted open-market operations after almost a decade without them.
Problems loading this infographic? - Please click here
Source: Haver Analytics, Man GLG; as of 4 October 2019.
Problems loading this infographic? - Please click here
Source: Bloomberg; as of 25 October 2019. Arrow shows period when net Treasury issuance was close to zero on average prior to debt ceiling rollover
Additionally, the net 12-month Treasury issuance and the projections for issuance of long-term Treasury notes and bonds is increasing on a large scale (Figure 7).
Figure 7. 12-Month Rolling Net New Issuance of US Treasury Debt
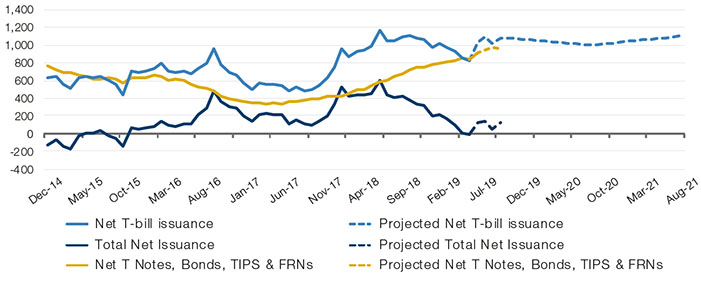
Source: Haver, US Department of Treasury, Man GLG; as of 30 September 2019.
Indeed, we would argue that the funding issues we saw in September in the US money market was a small taste of what is yet to come. The Fed may address the stresses in the short end of the curve via open market operations or the purchase of T-bills to inject short-term liquidity. However, the massive injection of duration produced by the increased Treasury issuance is not being neutralized by the Fed. To that end, the Fed would need to buy bonds, not only in the short end, but across the curve to an amount that would offset the USD600-billion net increase in annual Treasury issuance versus the issuance levels prior to the tax reform.
Moreover, it if had not been for the flip-flop by the Fed from hawkish to dovish late in 2018 and the restriction imposed by the debt ceiling from March 2019 onwards, the adjustment would have started much earlier. However, these two developments led market participants into believing that rates would never go up and that central banks could fight any sort of risk affecting financial assets. In turn, this belief drove the accumulation of massively long rate positions (Figure 8) and overexposure to EM high yield credit (Figures 9, 10). Indeed, Figure 8 shows that on the back of the Fed flip from hawkish to dovish, speculative investors went from their largest short rate position ever (during the first half of 2018) to the largest long duration position ever. (Zero is the level that indicates neutrality.)
Problems loading this infographic? - Please click here
Source: Bloomberg; as of 25 October 2019.
Meanwhile, issuers took advantage of the appetite for duration – and its close substitute, credit risk – in order to issue as long as they could. Figure 9 shows the amount of duration-dollars (akin to DV01) embedded in the EMBIG index has grown exponentially over the last year, implying that real money investors are running extreme positions in terms of both duration and credit exposure.
Figure 9. Duration-Dollars Embedded in EMBIG Index
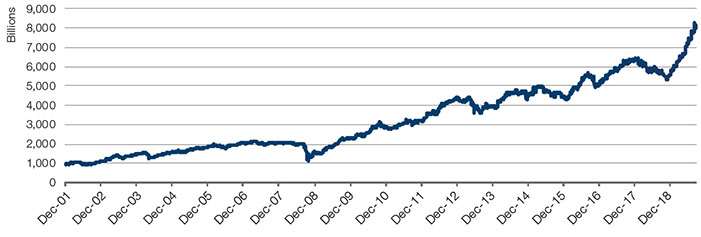
Source: JP Morgan; as of 24 September 2019. Market data provided for illustrative purposes only.
Figure 10 shows that in the periods where the JPM EMBIG EM high yield (‘HY’) segment outperformed JPM EMBIG investment grade (‘IG’) sector (i.e. in the first seven months of 2019 and in September 2019), most EM managers outperformed the JPM EMBIG. Conversely, in August, when JPM EMBIG EM high yield suffered, most managers underperformed. In our view, this is evidence that the majority of EM hard currency managers had the bulk of their exposure to the least creditworthy countries, and that those overweights were very large.
Figure 10. Relative Performance of EM Hard Currency Managers Versus Benchmark in 2019
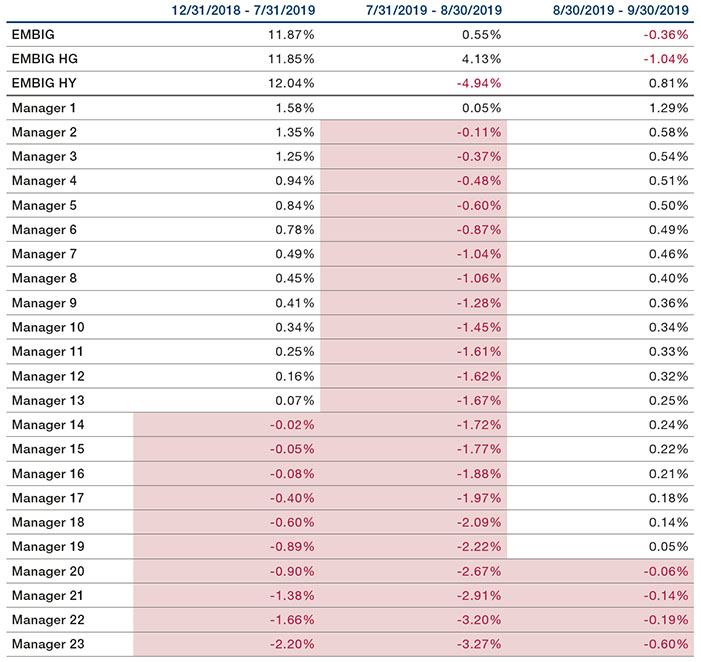
Source: Bloomberg; as of 30 September 2019. The shaded area above is represented by 23 mutual fund managers among the eVestment Emerging Markets Fixed Income – Hard Currency Index. The criteria for the selection of the 23 mutual fund managers are based on: 1.Total AUM of $500mm or greater per eVestment; 2. Mandate that was broad indices EMBIG/EMBIG Div strategy (ie. not a niche strategy like IG only or frontier markets only) and 3. Asset manager has a traded daily liquidity mutual fund. Performance is measured vs the index that each fund uses – roughly 2/3 are EMBIG Div, 1/3 EMBIG. The above illustration are not representative of any Man product or any strategy and are being shown for informational purposes only, and should not be construed as a recommendation for purchase or sale. We make no representation that past performance is indicative of future results.
Factor 3: US Inflation
US core PCE (the Fed’s preferred indicator of inflation) bottomed between in March and May – at 1.48% year-on year – and has, in just three months, accelerated to 1.77% as of the end of August (Figure 11). Core CPI bottomed in May at 2.0%; it too has accelerated to 2.4% year-on-year.
Headline inflation has been more moderate, courtesy mainly of the weakness in oil prices. However, if Brexit does not materialise and the trade friction with China stabilises over the next few months, this level of core CPI and the trend are not levels that warrant further cuts. In fact, it’s quite the contrary.
Problems loading this infographic? - Please click here
Source: Bloomberg; as of 25 October 2019.
Conclusion
It is true that the European Central Bank has announced a new quantitative package since March. However, it is also true that the Bank of Japan announced that it would stop buying 10-year (and longer) bonds, partially neutralising the global monetary impact of the ECB. Even when adding the resumption of organic growth of the Fed balance sheet, the overall growth of the three central banks’ balance sheets will not be enough to compensate for the increase in Treasury issuance (without even considering the increase in the issuance of long-term bonds at the expense of T-bills).
In short, we would change our view if the arguments on EM fundamentals, Treasury supply or inflation dynamics in the US explained above changed. However, until we see developments that would move the needle the other way, we are likely to keep our heads down and maintain our defensive view on EM debt.
You are now exiting our website
Please be aware that you are now exiting the Man Institute | Man Group website. Links to our social media pages are provided only as a reference and courtesy to our users. Man Institute | Man Group has no control over such pages, does not recommend or endorse any opinions or non-Man Institute | Man Group related information or content of such sites and makes no warranties as to their content. Man Institute | Man Group assumes no liability for non Man Institute | Man Group related information contained in social media pages. Please note that the social media sites may have different terms of use, privacy and/or security policy from Man Institute | Man Group.