Read more on our thoughts on emerging markets in light of the FOMC decision on 20 March.
Read more on our thoughts on emerging markets in light of the FOMC decision on 20 March.
March 27 2019
The purpose of this note is to update on our thoughts on emerging markets (‘EM’) in light of the decision made by the Federal Reserve on overnight rates and balance sheet contraction, and its potential impact on our asset class.
As those who follow us know, we have been very negative on the outlook for both the hard currency and local currency indexes as a consequence of a combination of the following factors:
- Poor current account performance given the ‘cheap’ valuation of EM currencies due to a combination of a structural deterioration in the terms of trade (prices for EM countries exports, and in the credit metrics of these countries since the global financial crisis (‘GFC’).
- Our view that the increase in the net supply of higher quality government bonds to be absorbed by private market participants will crowd out the demand for assets that have been substitute for Treasuries, higher quality European government bonds, and JGBs on the margin. This could, in turn, force further real exchange depreciation across EM economics to compensate for the decrease in capital flows going to substitute assets.
- Our belief that inflation in the US will accelerate, which in turn could force the Fed to go back into tightening mode, in a context where market participants price cuts going forward.
We have discussed at length point 1 in previous notes and in our outlook. We will thus focus on points 2 and 3 in this note and in the implications that this may have on our investment strategy.
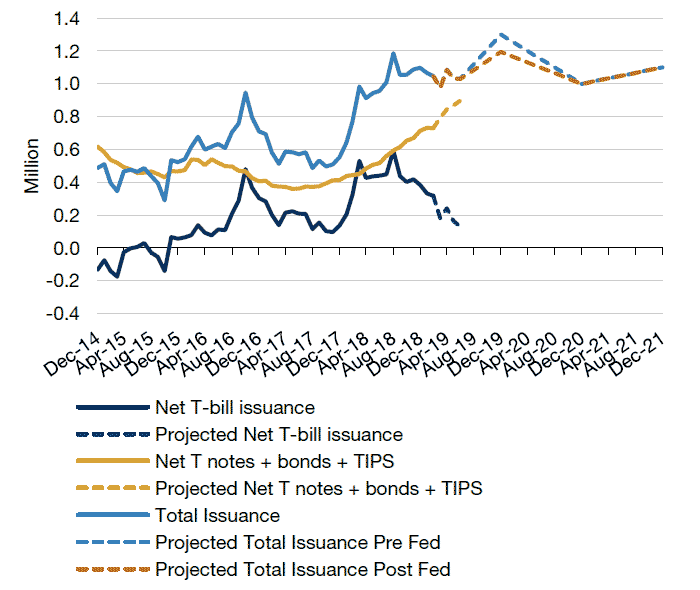
On point 2, Figure 1 shows our estimates of the rolling net new issuance of Treasury debt on a rolling 12-month basis, before and after the Fed decision on 20 March.1 We had initially assumed in our calculations a Fed balance sheet contraction to USD3.7 trillion, while the Fed announcement implies a contraction to USD3.75 trillion. As the figure shows, the implication over the increase in US Treasury Supply from 2018 onwards is relatively insignificant.
Please note projected issuance is provided by Man GLG’s emerging markets debt team. These projections should not be relied upon and are subject to change. There can be no assurance that these projections are now or will prove to be accurate.
As we have mentioned previously, the private market could have to absorb the roughly USD600 billion in net additional annual Treasury supply increase, and also the EUR 360 billion annualized of bonds that the ECB has stopped buying from the market. Thus, in annual terms, the net increase in the supply of US and European government bonds continues to be around USD1 trillion annually, a number that is almost twice as large as all of the hard currency-denominated issuance coming annually from EM sovereigns and corporates, or four times the size of the increase in stock buybacks seen in the US in 20182 (what likely helped take the US equity market to the all-time high and keep it there even when other equity markets were selling off) on the back of tax reform. The bottom line is that even without the Fed contracting the balance sheet, the private sector may have to absorb an additional trillion USD worth of ‘high-quality’ government bond issuance that did not exist before (at least for the private sector) and other assets could lose that USD1 trillion-dollar bid on an ongoing basis.
Figure 1. 12-Month Rolling Net New Issuance of US Treasury Bonds

Source: Haver, U.S. Department of Treasury, Man GLG as of March 20, 2019.
On point 3, we believe the Trump administration has mishandled the economy (i.e. the government shutdown and erratic management of the trade policy). However, with the end of the shutdown and the Fed backflip from hawkish to dovish (they called this reaching a neutral setting for monetary policy), the high-frequency data in the US economy is picking back up. Weekly homebuilders surveys3 have been rebounding; mortgage rates came down4; the Empire and Philadelphia manufacturing indexes5 surprised on the upside; unemployment claims6, new house prices and consumer sentiment7 have also improved; cold weather (that prevented normal activity for some periods) is ending; financial conditions8 have expanded; US job openings9 are in record territory; and household formation10 is back above the solid levels that we saw from 1995 to 2005.
We find it difficult to believe, in light of the above, that unless we have a significant external shock such as a hard Brexit, or a bad end to the Chinese trade negotiation, inflation in the US will remain as subdued as the 50% probability of a Fed Funds cut over the next 10 months would imply. As we have indicated in previous notes and in our outlook discussions, we do believe that if any of the significant accidents such as those outlined above are avoided, activity in the US could recover, inflation could accelerate and core inflation could get through the unofficial core PCE11 targets set by the Fed – that seems to be the new target to be pursued under a potential inflation averaging regime (if the Fed decided in the future to pursue it).
We feel that against the backdrop described above, our defensive positioning is optimal. We believe that the frothiness exhibited by the markets may be an indicator of a meaningful correction. A very clear example, in our opinion, is what we currently see in the currency markets where volatilities implied in EM currency pairs and EUR against USD are close to historical lows12 (i.e. some market participants, likely quant/trend following funds would appear to have developed an appetite to reach for yield this way), and there is risk for meaningful downside, in our view.
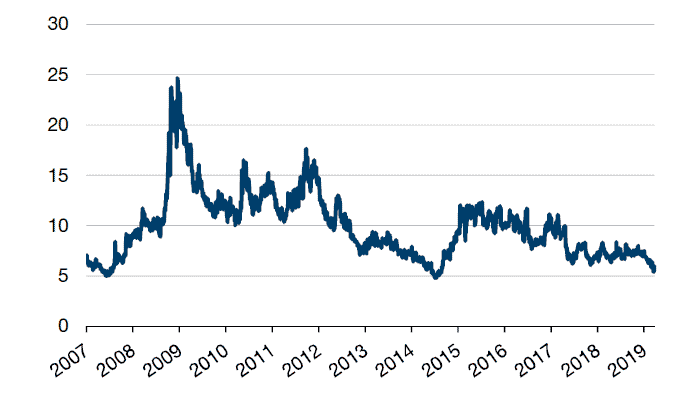
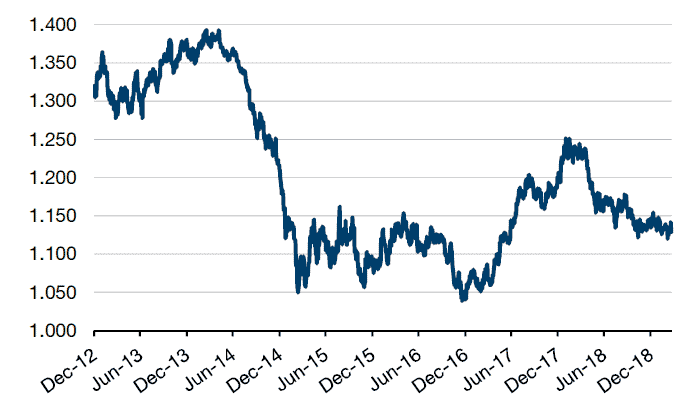
A simple example of the potential exuberance of the market is presented in the charts below. Figure 2 shows how EURUSD implied volatility is today at levels comparable to those seen right before the global financial crisis or in early 2014 right before EURUSD fell from 1.40 to 1.05 in less than a year.
Figure 2. EURUSD Implied At-the-Money Forward 3-Month Volatility

Source: Bloomberg, as of March 21, 2019.
Figure 3. EURUSD Cross

Source: Bloomberg, as of March 21, 2019.
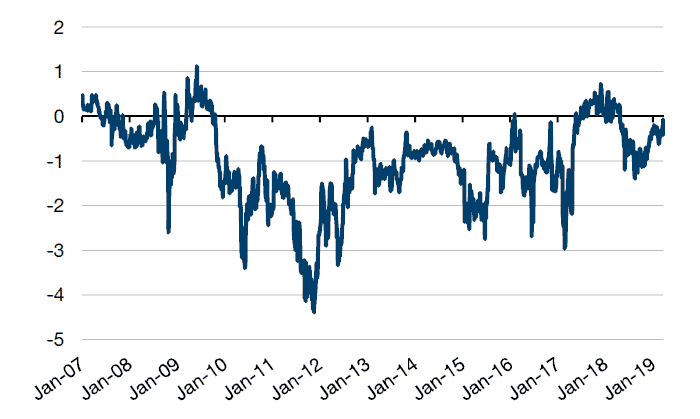
In addition, the reader can see in Figure 4 that EURUSD risk reversals trade in the upper end of the historical range.
Figure 4. EURUSD 25Delta 3-Month Risk Reversals

Source: Bloomberg, as of March 21, 2019.
We find it hard to comprehend that – 10 days away from a potential Brexit crash, and/or with the problems that we see with the gilets jaunes in France and the Italian government / EU government frictions – market participants could be so comfortable to risk getting exponentially long EUR (the potential consequence of the current market positioning) if any ’unforeseen’ event were to happen.
The reason why we dwell in the EURUSD market is simply because it is the most liquid, transparent and less subject to manipulation (direct or indirect through liquidity injection) from central banks. We believe the three figures above defy common sense and are a sign of how complacent market participants have become. The same dynamics (low vol and risk reversals in most EM currency crosses against USD) are present in EM FX and even more obvious in some EM hard currency markets e.g. the USD3 billion multi-tranche new issue by Ghana on 19 March where the book was, according to the underwriters, USD20 billion in size. Call us old-fashioned, but USD20 billion is 34% of GDP13 (this is the last rebased GDP – they recalculated it and increased the estimate in discrete estimates in 2010 and in 2018 prior to announcing their intention to issue USD50 billion worth of ‘century’ bonds).
We believe that the only instance where the Federal Reserve does not end up tightening monetary policy further given the dynamics specific to the US economy is one where a foreign accident puts the US recovery at risk. If such accident were to happen, it is unlikely to be a positive for EM in our view. On the other hand, if the US economy ends up recovering and inflation accelerating as we believe, the US Treasury curve has the potential to steepen by a degree of magnitude that could be hard to assimilate for our asset class.
1. Please note projections provided by Man GLG’s emerging markets debt team should not be relied upon and are subject to change. There can be no assurance that these projections are now or will prove to be accurate.
2. Man GLG GEMD team estimates.
3. Source: National Association of Home Builders (latest period March 2019).
4. Source: Freddie Mac Primary Mortgage Market Survey (latest period March 21 2019).
5. Source: Federal Reserve Bank of New York and Philadelphia Federal Reserve (latest period March 2019).
6. Source: Department of Labor (latest period week ending March 16, 2019).
7. Source: University of Michigan preliminary March 2019 sentiment index.
8. Source: Bloomberg U.S. Financial Conditions Index (week ending March 18 and the 20-day moving average).
9. Source; Bureau of Labor Statistics (monthly, latest period January 31, 2019).
10. Source: Housing Vacancies and Home Ownership report, Census Bureau (latest period December 2018).
11. Core PCE price index is defined as personal consumption expenditure (PCE) prices excluding food and energy. The core PCE price index measures the prices paid by consumers for goods and services without the volatility caused by movements in food and energy prices to reveal underlying inflation trends.
12. Source: Bloomberg, as of March 21, 2019.
13. Source: World Bank (latest period December 2017).
You are now exiting our website
Please be aware that you are now exiting the Man Institute | Man Group website. Links to our social media pages are provided only as a reference and courtesy to our users. Man Institute | Man Group has no control over such pages, does not recommend or endorse any opinions or non-Man Institute | Man Group related information or content of such sites and makes no warranties as to their content. Man Institute | Man Group assumes no liability for non Man Institute | Man Group related information contained in social media pages. Please note that the social media sites may have different terms of use, privacy and/or security policy from Man Institute | Man Group.