Following a decade of growth dominating value as an investment style, there is an increasing chorus singing the virtues of value. But is now the time to add value exposure?
Following a decade of growth dominating value as an investment style, there is an increasing chorus singing the virtues of value. But is now the time to add value exposure?
February 2020

Introduction
Following a decade of growth dominating value as an investment style, there is an increasing chorus singing the virtues of value and the current opportunity set. Admittedly, much of the noise is coming from a possibly biased portion of the buy-side community, namely those that rely on value (either systematically or fundamentally). There has also been increasing pro-value commentary from the sell-side and academics, and many allocators and fiduciaries are wondering: is now the time to “sin a little”1 in value?
Two general arguments are being made to justify a bullish outlook for value investing: 1) the duration and magnitude of the current value drawdown is excessive; and 2) the relatively wide spread today between cheap and expensive stocks. While there is no debate over the recent difficulties of value, and it is true that historically value has recovered strongly following periods of poor performance, that is a fairly weak intellectual argument. However, a wider-than-average disparity between cheap and expensive stocks is a more compelling argument, and worth exploring in more detail.
One other topic that deserves attention is the current relationship between value investing and the interest-rate environment. One of the reasons value has struggled so much has been the low-growth, low-inflation, and declining interest-rate (both real and nominal) environment. While it is entirely unlikely that the next decade will witness a similar decline in interest rates (which would be an ongoing headwind for value investing), it is not at all clear that growth and interest rates will revert towards a historical mean (which would be a tailwind for value investing). We think investors should realise that expecting materially above average returns to value is also a bet on normalisation of the macroeconomic environment.
In this paper, we hope to: 1) give an unbiased view of the current opportunity set; and 2) describe and show empirically the relationship between value returns and the interest-rate environment.
The Current Opportunity Set for Value
There are different methodologies to measure valuation stretch, and there are also multiple metrics one can focus on.2 We primarily focus on two methods for measuring the degree of ‘spring-loaded’ stretch in equity valuations: Carry and Convergence.
The Carry methodology looks at the difference between cheap and expensive securities over time. For example, if we use dividend yield as our metric, then if the 80th percentile dividend yield is 2.8% and the 20th percentile dividend yield is 0%, our raw stretch method would be 2.8%. We could then measure this over time and see where the current opportunity lies relative to history.

There are two specific issues with the Carry approach. The first is that it is sensitive to overall market levels. For example, assume the 80th percentile earnings yield is 10% and the 20th percentile earnings yield is 4%, for a raw stretch of 6%. If the market and every stock in it doubles, that raw stretch would fall from 6% to 3% (5% - 2%). The Carry method widens when the market falls (we will see that shortly in 2008) and falls when the market rises. However, to the extent that the returns to value are driven by Carry, this may be a reasonable outcome.
The second issue is Carry assumes growth parity between the cheap and expensive stocks, but expensive stocks generally do grow faster than cheap stocks.3 Ideally, one would adjust for the dispersion in growth expectations, but in practice this is very difficult to do.
The Convergence methodology measures the return opportunity if cheap and expensive securities converge to valuation parity. Interestingly, it addresses the first issue above, but potentially exacerbates the second issue.

This method is agnostic to the overall level of the market. In the above example, if the median earnings yield is 8% (with the cheap and expensive stocks being at 10% and 4%, respectively), the expected return from convergence is 75% (the cheap stock would go up 25% and the expensive stock would fall 50%). If the market and every stock in it doubled, the expected return from convergence would not change. But this approach may be more problematic in that it inadvertently assumes cheap and expensive stocks should have the same multiple – a highly dubious proposition. Changes in fundamentals over time may drive convergence in valuation as much or more than price moves (i.e. companies that grow into their multiples).
In any event, there is no perfect methodology to judge valuation dispersion (short of a crystal ball). As such, to give an unbiased view of the current environment, we will show both approaches using a handful of different metrics.
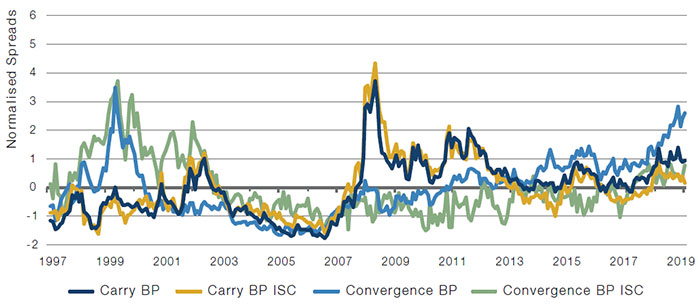
So is the current opportunity in value extraordinarily wide? It is if you focus on raw B/P, at least according to the Convergence method (Figure 1). Dispersions stands at 2.6 standard deviations4, nearly as high as it was during the tech bubble. This is the most commonly used metric to display the current value opportunity (perhaps because it is also the most compelling).5 Interestingly, on an industry/sector/country-adjusted basis6, the spread is still wide, but less than 1 standard deviation. How much weight should we place on B/P-based empirics? Increasingly, academics are pointing to shortcomings in book value as the economy becomes less asset intensive, and furthermore, to capitalise on the massive stretch here, one needs to take significant country and sector exposures.7
Figure 1. Global B/P Valuation Spreads
Source: Man Numeric; as of 29 November 2019. Global top 1,000 stocks by market cap.
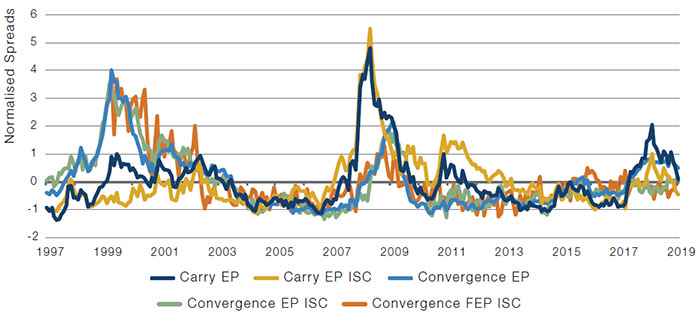
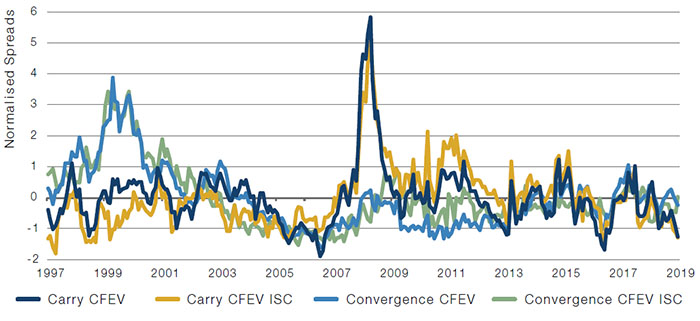
If we focus on other, potentially more relevant metrics, we see that book value might be as good as it gets. Looking at trailing and forward E/P (Figure 2) and EBITDA/EV (Figure 3), the current opportunity appears normal. Figure 2 shows the difference between the Carry and Convergence approaches. During the late ’90s bull market, the Convergence opportunity rose significantly while the Carry opportunity barely budged. During the Global Financial Crisis (‘GFC’), the opposite occurred as the market fell rapidly.
Figure 2. Global E/P Valuation Spreads
Source: Man Numeric; as of 29 November 2019. Global top 1,000 stocks by market cap.
Figure 3. Global CF/EV Valuation Spreads
Source: Man Numeric; as of 29 November 2019. Global top 1,000 stocks by market cap.
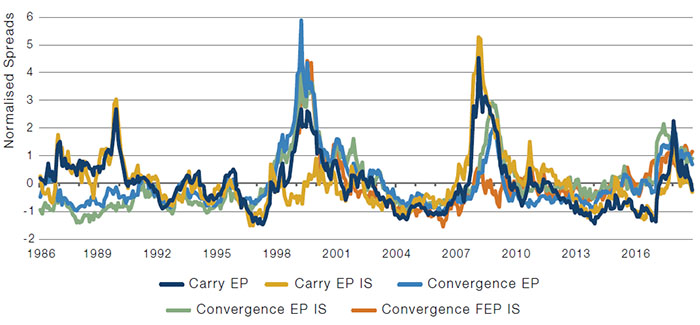
Globally, the opportunity for value appears somewhere around average looking at these various views. The US is the one area where the opportunity looks more attractive, particularly if we focus on the convergence method. Using E/P and EBITDA/EV, the industry/sector-adjusted opportunity sits around 1 standard deviation wide (Figures 4, 5), and have not often been exceeded.
Figure 4. US E/P Valuation Spreads
Source: Man Numeric; as of 29 November 2019. US top 1,000 stocks by market cap.
Figure 5. US EBITDA/EV Valuation Spreads
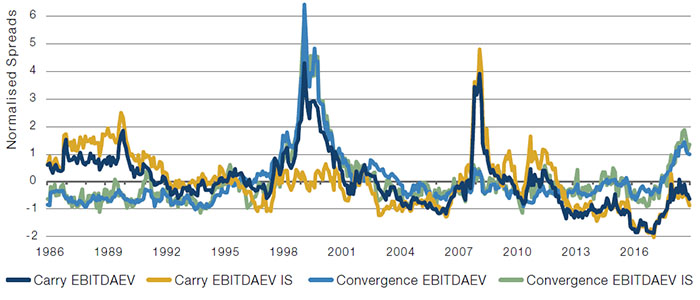
Source: Man Numeric; as of 29 November 2019. US top 1,000 stocks by market cap.
Indeed, from a value perspective, the opportunity in the US appears more attractive than developed markets more broadly, as the opportunities in Europe and Japan appear average.8 Another area where value does appear modestly attractive relative to history is emerging markets (Figures 6, 7). In fact, on a forward E/P basis, the opportunity is as wide as it has been since the inception of that data. It is likely that the difference between trailing and forward E/P spreads in EM suggests the market is sceptical of an expected rebound in earnings in cheap stocks.
Figure 6. Emerging Markets E/P Valuation Spreads
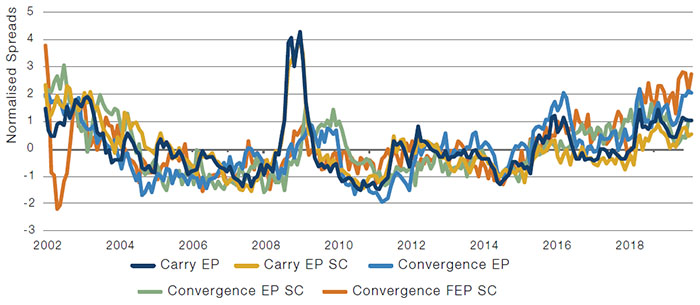
Source: Man Numeric; as of 29 November 2019. Emerging-market top 500 stocks by market cap.
Figure 7. Emerging Markets EBITDA/EV Valuation Spreads
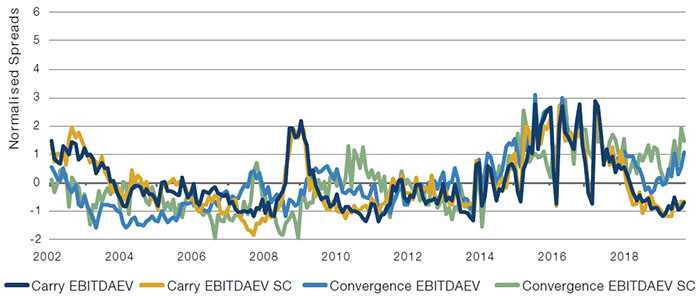
Source: Man Numeric; as of 29 November 2019. Emerging-market top 500 stocks by market cap.
Value and Interest Rates
One of the key investment themes of the last decade has been the inextricable march towards zero (or negative) nominal interest rates. In reality, this trend began nearly four decades ago in the US following a successful effort to defeat inflation, and travelled to Japan and other developed markets over the next decade. More than 20 years ago, 10-year nominal interest rates in Japan fell below 1%. Although they quickly rebounded above 2%, they have slowly and steadily marched from 2% to 0% over the last two decades, and they have literally been within 50 basis points of zero for the last five years.
Why are we discussing this?
Importantly because it at least raises the possibility that this low-growth, low-inflation, low-interest rate environment that the rest of the developed world has been introduced to over the last few years may have legs. And that environment (or a change in that environment were it to occur) has implications on the prospective performance of value.
There are two potential relationships between value and interest rates. The first is an indirect relationship: an increase in interest rates reflects an improvement in the economic environment which is better for value stocks because they may be more economically sensitive. This relationship does not always hold (for example after the tech bubble), but is intuitive. The second relationship is direct: value equities are lower duration than growth equities because they derive more of their value from near-term economics relative to their growth counterparts. So, a material decline in interest rates would have (and we believe has had) a negative impact on value. A material rise in interest rates would likely be a boon to value investors – but how likely is that? At a minimum, we should be aware that value is a pseudo-short duration strategy.
Empirically, is this actually playing out in equity markets? Increasingly, it has been. During the chaos of the GFC, a lot of relationships were drowned in noise. However, over the last decade, momentum and growth returns have been increasingly positively related to US 10-year treasury returns. On the opposite side, book-to-price and earnings yield today have rolling ex-post betas to US 10-year treasury returns of between -0.70 and -0.85.9 Today, one can almost predict the returns to naïve factors merely by looking at what interest rates are doing. This relationship could change over time, as there is some empirical evidence a low level of interest rates may be conducive to this effect.10
Figure 8. Rolling 36-Month Beta of Global Factor Returns to US 10-Year Treasury Returns
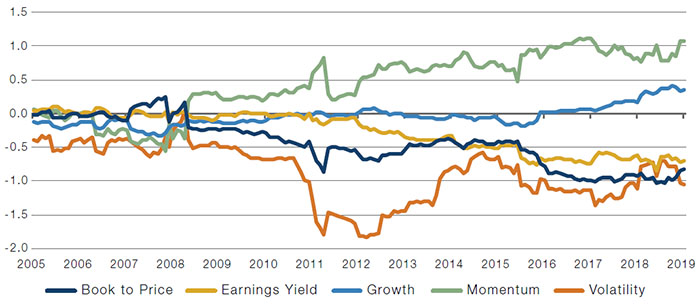
Source: Man Numeric; as of 1 December 2019.
Conclusion
It has been a difficult couple of years for value and factor investing, and it has been no less difficult for us than others. We all owe it to ourselves to ask what we did right, what we did wrong and what we can do better going forward? Those investors smart enough or fortunate enough to have not been excessively exposed to the value drawdown ought to ask themselves if that approach still makes sense today. Investors who have suffered through this drawdown (like ourselves), but also lived through and eventually prospered after similar periods historically, need to determine how similar the current environment is to historical episodes and how we can best positions ourselves for the future. Perhaps we relied too heavily on value before, but that should not inform our decision today. Is now the time to add value exposure? Or do we still have too much value exposure?
Looking at the totality of the evidence, the outlook for value may not be quite as rosy as many investors expect. While it is clear that the dispersion in raw B/P multiples is particularly wide by historical standards, it is not clear that the dispersion in relative value metrics is materially wider than normal. The two geographies that do stand out as having above-average dispersion, and hence above average outlooks, are the US and emerging markets. But neither case would appear to be of the table pounding variety (at least not to these authors).
Additionally, it is imperative to understand the relationship between the performance of value and interest rates. While we do not expect interest rates to decline at the same rate as the last several decades (that would be more or less impossible), we do believe ‘lower for longer’ might be an actual thing; this would not preclude positive performance for value, but also does not necessarily support an extreme recovery. Lower economic uncertainty around global trade and the US elections or a broad economic recovery would likely help value and drive interest rates up; however, a higher level of interest rates may have consequences on overall market valuations, particularly in the US.
So what are we going to do with this information? While we strive for a balanced and multidisciplinary approach to investing, the totality of this data might suggest opportunities to over or underemphasize value in the context of our broader process. With the benefit of hindsight, the narrow value opportunity a few years ago, and again in the mid 2000s, may have signaled an opportunity to de-emphasize value. Today, the opportunity for value is a little bit in the eye of the beholder, as some investors are extremely bullish, while we are more balanced, but constructive, especially in the US and emerging markets.
With contribution from: Paul Njoroge, Yudi Lu and Hang Yang.
1. Cliff Asness; Cliff’s Perspective: It’s Time for a Venial Value-Timing Sin; 7 November 2019.
2. B/P, P/B, Forward E/P, Backward E/P, EBITDA/EV, etc, etc.
3. Ed Cole; Value Is Dead, Long Live Value; February 2019.
4. We normalise spreads over the entire history so we can see how abnormal spreads currently are.
5. For example: Has value met its Waterloo?, Bernstein Research, 19 June, 2019; Value is Dead, Long Live Value, Oshaughnessy Asset Management, July 2019; The Value Conundrum, JPMorgan Research, June 2019.
6. Labelled ISC in the chart.
7. The Carry method does not appear as wide for B/P, but is not particularly relevant here because book value is a stock variable (measured at one point in time), not a flow variable (like almost all other value metrics such as earnings, cash flows, etc).
8. Data available upon request.
9. As of 30 December 2019.
10. Not shown, but longer-term data suggests a similar relationship may have existed during the low interest rate environment of the 1950s and early 1960s.
You are now exiting our website
Please be aware that you are now exiting the Man Institute | Man Group website. Links to our social media pages are provided only as a reference and courtesy to our users. Man Institute | Man Group has no control over such pages, does not recommend or endorse any opinions or non-Man Institute | Man Group related information or content of such sites and makes no warranties as to their content. Man Institute | Man Group assumes no liability for non Man Institute | Man Group related information contained in social media pages. Please note that the social media sites may have different terms of use, privacy and/or security policy from Man Institute | Man Group.