A series of observations have accumulated to reveal an interesting case for a value tilt in equities.
A series of observations have accumulated to reveal an interesting case for a value tilt in equities.
February 2019


Introduction
Every Tuesday, teams from across Man Group assemble for a short meeting to share perspectives on opportunities, risks and anomalies in markets. Man Group explicitly eschews a house view, but wholeheartedly embraces the potential benefits of sharing insights across the platform. The agenda for these meetings reflects the various focuses of the teams at any point in time, such that there is often little apparent overlap.
However, occasionally the stars align, and we see complementary conclusions from teams looking at things in completely different ways. The first few weeks of 2019 have been such an environment, where a series of observations have accumulated to reveal an interesting case for a value tilt in equities, with potential implications for economic momentum, just at the point in time when mainstream commentary is turning gloomy on global growth.
Dan Taylor, Greg Bond, Charlotte Lin and Shicong Wang wrote an excellent, comprehensive piece on value in September 2018, titled: Is Value Dead (Again)? Our aim here is not to rehash their debate about the merits of value in an investment process, but rather is a summary of the different discussion points, and in conclusion, what these observations from the strategy and multi-asset teams might mean for the global economy.
1. Flows to Mining Are as Adverse as 2016, Despite Meaningful Improvements in Sector Fundamentals
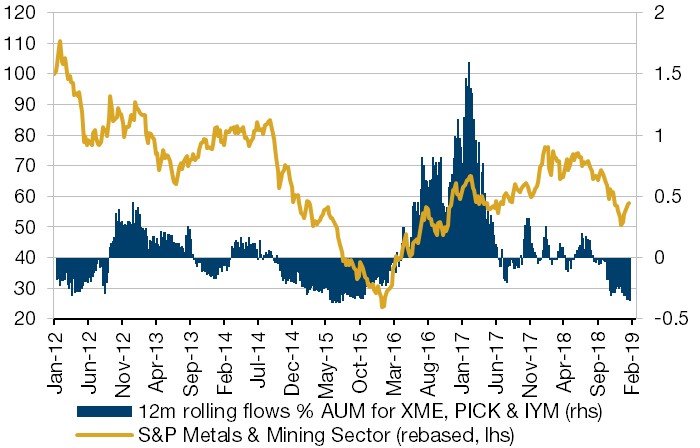
Man GLG’s metals & mining team has observed that there has been a meaningful shift away from the mining sector in late 2018, which we have noticed in investor survey data and ETF flows. While not perfect, flows do give us some quantifiable insight into euphoria and despondency.
Figure 1 shows the aggregate 12-month trailing flow for three of the largest sector-focused ETFs (SPDR S&P Metals & Mining, iShares MSCI Global Metals & Mining Producers, iShares US Basic Materials ETF) plotted against the price of the S&P Metals & Mining Sector. Twelve months ago, these three ETFs had an aggregate AUM of almost $3 billion (a testament in itself to how out of love markets are with commodity cyclicals). This now stands at a little more than $1 billion, with 12-month rolling outflows at 35% of starting AUM.
Figure 1: 12-Month Trailing Flow for Metals & Mining ETFs
Source: Bloomberg; As of 25 January 2019
Notably, this is a larger 12-month outflow than in January 2016, when there were credible concerns about the ability of some miners to survive given woeful capital discipline, reflected in heavily leveraged balance sheets and poor returns on capital in an environment of deflating commodity prices. This is reflected in Figure 2, which shows the all-country world mining index net debt/EBITDA, and in Figure 3, which shows the return on capital. That investors should be as bearish now as they were when the sector was almost bust three years ago may suggest some degree of asymmetry in this sector, historically one of the cornerstones of value (the other being financials).
Problems loading this infographic? - Please click here
Source: Bloomberg; As of December 2018
Problems loading this infographic? - Please click here
Source: Bloomberg; As of December 2018
2. Semiconductors Are Deep Into the Earnings Downgrade Cycle, But Stock Prices Have Stopped Reacting to Bad News
Man GLG’s innovation team has flagged growing inventories across the semiconductor industry, driven by slowing end demand (the slowdown in mobile handsets is clear to everyone) and exacerbated by double-ordering in late 2018 on fears of supply-chain disruption from the trade war. In many cases, inventory days are above previous cyclical peaks.
It takes time to digest this inventory, and as such, earnings estimates may continue to come down. However, it is notable that against this backdrop, many stocks have stopped reacting poorly to earnings misses. In fact, with almost 75% of the MSCI ACWI Semiconductor Industry index having reported as of 18 February, the average gain two days after results is almost 5%, having missed on the top line by c.3.5% in aggregate. 1
Problems loading this infographic? - Please click here
Source: Bloomberg; As of January 25, 2019
As suggested above, this is not a set-up to be banging the table for indiscriminate long positions across the sector, but it is part of the process required for trying to find a low. Broadly speaking, the sector is becoming more attractive than in the second half of 2018, in our view. So, this is another key part of the value spectrum where risks are starting to look more skewed to the upside.
3. Downgrades for Cheaper Stocks are Outperforming Downgrades for more Expensive Stocks
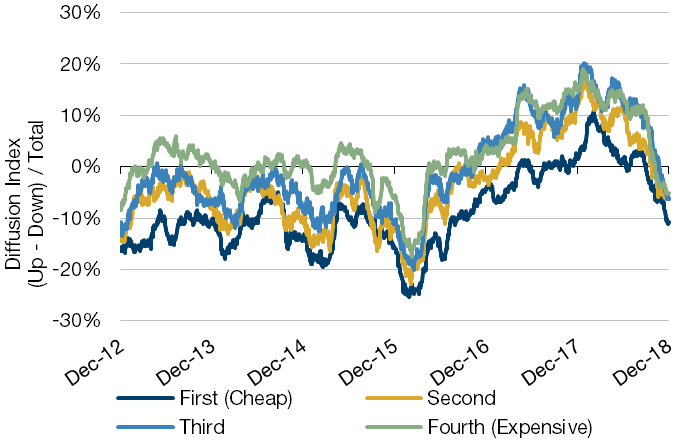
Researchers at Man Numeric have observed that earnings revisions historically tend to be monotonic – more expensive stocks see more favourable revisions. Figure 5 plots the revision diffusion index by quintile of value, where the diffusion index measures upgrades minus downgrades over the total number of revisions.
Figure 5: Earnings Expectations Are Falling…
Source: Man Numeric, Thomson Reuters, Global Core Universe #Diffusion Index based on estimate changes for FY1 and FY2 combined Period: December 2012 - December 2018
This monotonic relationship is evident through this period with the cheapest quintile experiencing the worst revisions during periods in which we looked. This is also depicted in Figure 6.
Unusually, in the three months to the end of December, analyst revisions have become more pessimistic for more expensive stocks than for cheaper stocks. There may well be cyclical implications from this dynamic, which we hope to examine in more detail in due course. However, at the least, it is reasonably intuitive to us that if cheaper stocks have more favourable momentum than more expensive stocks (even if that momentum is less bad rather than actually positive), it may improve the relative attractiveness of value.
Figure 6: … Faster for Expensive Stocks
| First (Cheap) | Second | Third | Fourth (Expensive) | |
|---|---|---|---|---|
| Current Level | -11% | -6% | -6% | -5% |
| Period Average $ | -6% | -2% | 1% | 0% |
| 3 Mo Change | -11% | -10% | -15% | -15% |
Source: Man Numeric, Thomson Reuters, Global Core Universe Period: December 2012 - December 2018
4. Cheaper Stocks Are Unusually Cheap
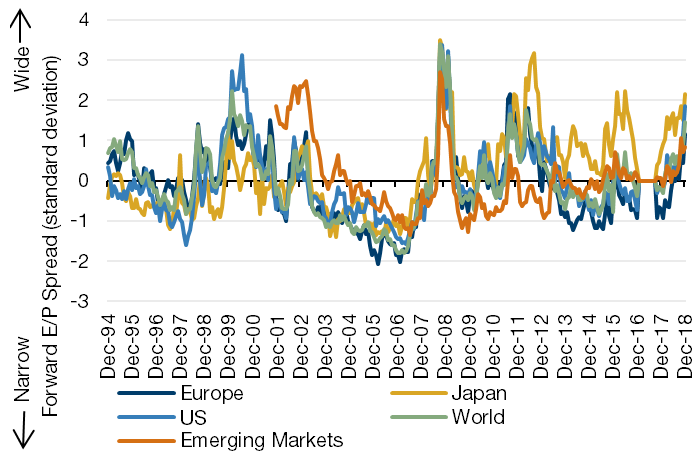
A separate observation from Man Numeric is that cheaper stocks have become unusually cheap relative to more expensive stocks. Figure 7 shows the spread of the cheapest quintile versus the most expensive quintile on forward earnings yield by region. At the end of 2018, spreads in the US and Japan were c2 standard deviations from the mean. Not shown here (due to much shorter data series), but of great interest to us is China A, where value spreads blew out to c3 standard deviations from mean in the fourth quarter of 2018. 2
Figure 7: Global Valuation Spreads Widen
Source: Man Numeric, Bloomberg; As of December 31, 2018. Standardized spread between the current forward Earnings/Price spread and forward Earnings/Price spread since inception (developed markets 1995, emerging markets 2002). Europe, Japan, US, and World are represented by the largest 400 names per region by market cap. Emerging Markets are represented by Man Numeric’s full stock selection universe for EM Core, which is approximately 3,600 of the most liquid EM stocks, including all of those in the MSCI EM Index.
5. China Lead Indicators Are Turning Up, Which Historically Has Driven Value Outperformance
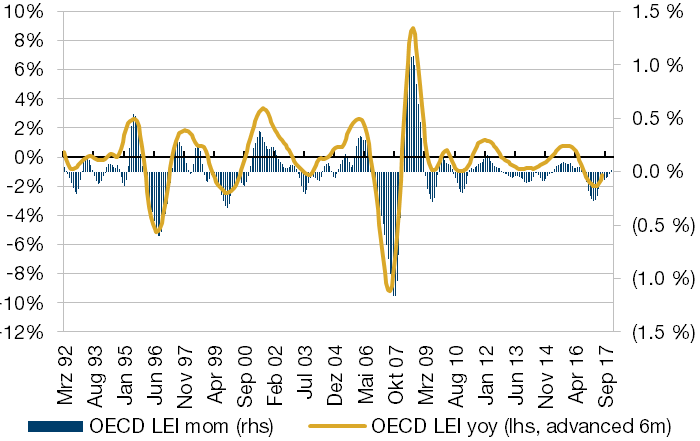
In the release of November and December lead indicators from the OECD, China’s lead indicator was one of the very few bright spots, contrary to the prevailing narrative of a relentless slowdown. Figure 8 shows the reacceleration of monthly data since mid-2018, which we have found historically tends to lead the more commonly-watched year-on-year measure by approximately six months.
Figure 8: China Back Into Expansionary Territory by Second Quarter?
Source: OECD, Man GLG; As of November 2018.
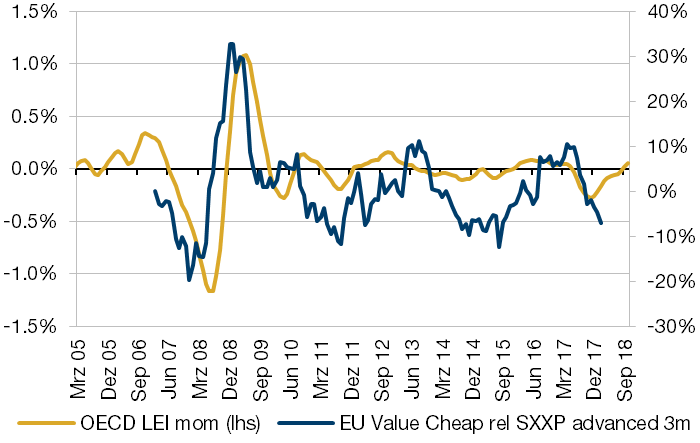
Turning points in economic cycles typically bring material changes in sector and factor leadership, as excessive confidence and pessimism is laid bare by changing demand conditions. This is evident in Figure 9, which plots Morgan Stanley’s European value factor relative to the Euro Stoxx 600 versus the month-on-month change in the China lead indicator. Given the preponderance of miners, chemicals, and autos and auto part-makers in Europe, it should not come as a surprise that European value can be influenced by the gyrations in the Chinese cycle.
Figure 9: European Value Influenced by Gyrations in Chinese Cycle
Source: Bloomberg; As of November 2018
Long Live Value
None of these inferences specifically makes a case for an exaggerated tilt towards value now. But a confluence of multi-disciplinary observations on the same subject does warrant some attention in our view, and does suggest that the balance between risk and reward for value-oriented strategies is potentially tilted to the upside at this point in time. These observations also beg two further questions:
- Does an increasingly constructive outlook for value carry any implications for the global cycle?;
- Why might these observations be wrong, and just another false dawn for a factor seemingly written off as dead?
Implications for Economic Momentum
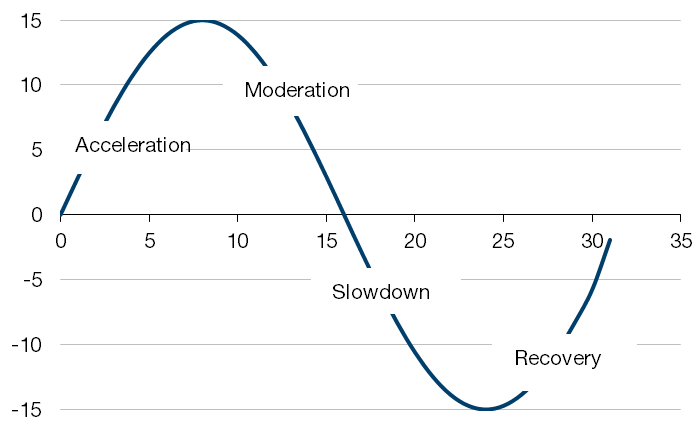
To try and gauge economic momentum across regions, and in a standardised way, the OECD’s series of leading indicators (CLIs) are useful tools. To determine different regimes for asset prices and factor preferences, economic momentum can be thought about as having four broad phases: acceleration, moderation, slowdown and recovery.
We believe it’s worth emphasising that these cycles have historically been more rapid than a full economic cycle: since 2011 (when world growth normalised at 3-3.5% in real-terms), there have been three leading indicator ‘slowdown’ periods and two subsequent ‘accelerations’. ‘Slowdown’ does not equal recession in the normal economic cycle sense.
Figure 10: Stylised Economic Momentum
Source: Man Group; For illustrative purposes only, not intended to represent actual market or economic performance.
In Figure 11, 12-month forward returns for MSCI World and 6-month relative returns for MSCI World Value from 1997 are averaged according to the phase in the cycle. We believe recovery is the best time for value as style – this is a point when the valuation of cheaper assets becomes more sensitive to changing perceptions of cyclical momentum, and where operating leverage at a single company level can have profound implications for corporate profitability and balance sheet health.
However, as Figure 11 shows, value’s outperformance is short-lived (hence the shorter period in the table): for 9-months forward, value performance is in line with the market. For 12-months forward, it was modestly negative, with the caveat that we believe that both skilled discretionary stock-pickers and sophisticated quant processes could potentially continue to wring alpha out of value styles beyond these time horizons.
Figure 11: Value Outperforms as Cycle Moves Toward Recovery
| Acceleration | Moderation | Slowdown | Recovery | |
|---|---|---|---|---|
| Value rel 6m forward | -0.5% | -0.7% | -0.5% | 0.4% |
| World abs 12m forward | 11.3% | 3.8% | -4.3% | 11.8% |
| Time spent in phase | 16% | 38% | 18% | 27% |
Source: Man Group; December 1996 – November 2018
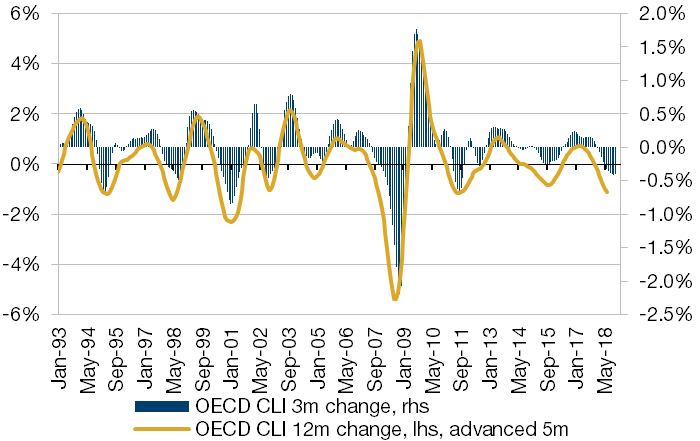
The November and December data have begun to trigger the first recovery signals, in which respect, the tempting inference from our observations about the attractiveness of value in global equities is that markets are beginning to discount a potential reacceleration in the global economy.
Figure 12: Discounting a Reacceleration in the Global Economy?
Source: Bloomberg; As of November 2018
Why Might These Observations Be Wrong?
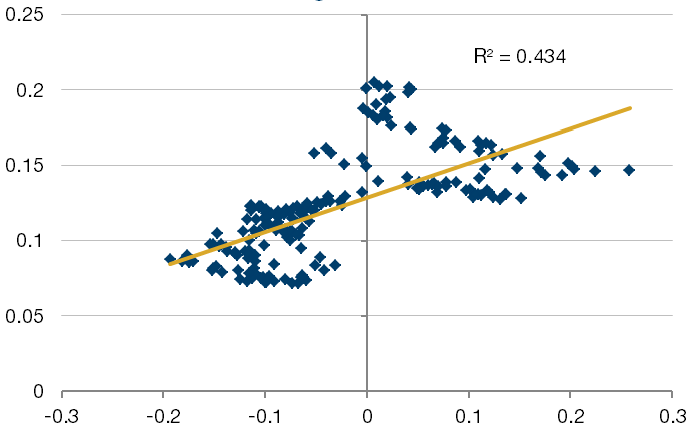
As discussed in Man Numeric’s Is Value Dead (Again)? paper, inflationary and rising interest-rate environments historically tend to help value by virtue of encouraging a reallocation away from long duration growth assets.
Figure 13: 60-Month Excess Return MSCI World Value Less MSCI World Versus % Change in OECD Total CPI
Source: Bloomberg; 1997 to December 2018
At a point when the Federal Reserve appears to have notably pivoted away from data dependency toward what may well be the peak of the monetary policy cycle, we believe the biggest risk to our observations on value is that policy and inflation have peaked. Of course, the other read is that the Fed is now more worried about growth than inflation, and that it could take an outbreak of inflation to put them back on a tightening bias.
Conclusion
Forecasting turns in the cycle (and pretty much anything else) is perilous. However, relying more on inferences from relationships that have shown persistence over time and knowing when the cards may be stacked more in favour of a particular process is, in our view, less so.
Indeed, we believe that the series of observations mentioned above have accumulated to reveal an interesting case for a value tilt in equities, with potential implications for economic momentum, just at the point in time when mainstream commentary is turning gloomy on global growth.
With contribution from: Rob Furdak (Man Numeric, Co-CIO), Priyan Kodeeswaran (Man GLG, Portfolio Manager) and Mark Ashton (Man GLG, Portfolio Manager).
1. Bloomberg
2. Man Numeric and Bloomberg
3. Based on the following indices: OECD Total leading indicators CLI Amplitude adjusted SA, MSCI World Index, MSCI World Value Index.
You are now exiting our website
Please be aware that you are now exiting the Man Institute | Man Group website. Links to our social media pages are provided only as a reference and courtesy to our users. Man Institute | Man Group has no control over such pages, does not recommend or endorse any opinions or non-Man Institute | Man Group related information or content of such sites and makes no warranties as to their content. Man Institute | Man Group assumes no liability for non Man Institute | Man Group related information contained in social media pages. Please note that the social media sites may have different terms of use, privacy and/or security policy from Man Institute | Man Group.