What does responsible investing need to do to become fully mature? Go short.
What does responsible investing need to do to become fully mature? Go short.
June 2020
"Short everything that man has touched."
— Mark Baum, The Big Short
Introduction
To some, responsible investment is a goody-goody exercise. You buy some stocks that you think are ‘responsible’ – exclude tobacco, include renewables, try not to buy anything that makes nuclear weapons and voila! A responsible investment portfolio, spotless and morally unimpeachable.
But is that enough?
We would argue that there is more that can be done to improve the quality of RI portfolios. It’s not just about identifying those companies that are making the world a better place. To take a leaf out of Mark Baum’s book, it’s also about shorting those companies that are harming the environment, not treating their employees and customers fairly or their shareholders well.
In this article, we will explore the dark side of responsible investing, focusing on the companies who perform poorly on environmental, social and governance (‘ESG’) metrics. Part I evaluates the effect of exclusion lists, currently the most popular way to exploit a negative view of the ESG performance of a stock. We examine the historical performance of exclusion lists and delve into the specific drivers of performance, in particular the impact on some of the most excluded industries. We also attempt to estimate the cost to a portfolio of divesting from some of the popular restricted names.
Part II takes things one step further and looks at the impact of expressing those negative opinions in a more direct way: shorting the worst offenders in ESG. We cover how shorting increases portfolio exposure to ESG themes, impacts on returns and affects drawdowns compared with a long-only implementation.
Part I: Negative Screening – the Earliest and the Largest Implementation of ESG
Negative or exclusionary screening was the largest sustainable investment strategy globally in 2018, with a combined AUM of USD19.8 trillion (Figure 1). This is larger than ESG integration and other strategies, including corporate engagement and shareholder action, which have also seen rapid growth in recent years.
Figure 1. Sustainable Investing Assets by Strategy and Region (2018)
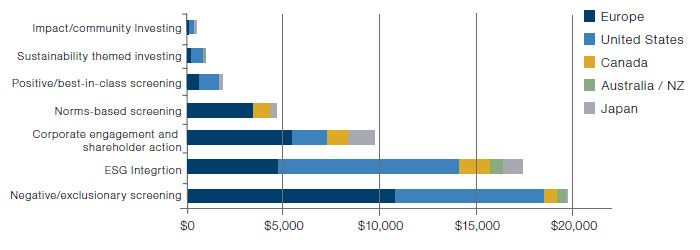
Source: Global Sustainable Investment Review; as of 31 December 2018.
Note: Asset values are expressed in billions of US dollars.
Breaking down the AUM of exclusions by region, negative screening was the most popular strategy in Europe as of the end of 2018 (EUR9.5 trillion in AUM). The region with the fastest growth was Canada, where negative screening AUM grew 64% from 2016 to 2018. In the US, Australia and New Zealand, where ESG integration dominates, negative screening is often leveraged to complement ESG Integration.
The popularity of exclusionary screening strategies is driven, to a large extent, by clients’ demand to restrict their portfolios from holding stocks that do not meet certain ESG criteria. Globally, as of the end of 2019, more than USD9 trillion in assets have restrictions with respect to common ESG concerns involving controversial munitions, nuclear weapons, tobacco and coal production (Figure 2). The assets and categories detailed in Figure 2 are based on data collected from multiple sources including public websites, company filings, press releases, etc. The data was then carefully aggregated by client origin and restriction type. Man Group maintains a version of these common restrictions, referred to as the Man Universal List. Separately, assets worth USD4.5 trillion are restricted from holding stocks with conduct-related issues such as environmental damage and financial crime, and USD2.3 trillion with regional/faithrelated (idiosyncratic) restrictions. European and Nordic clients make up the largest portion in terms of AUM across all types of restrictions, which explains why negative screening is the dominant strategy in these regions.
Figure 2. AUM with ESG Restrictions, by Client Origin
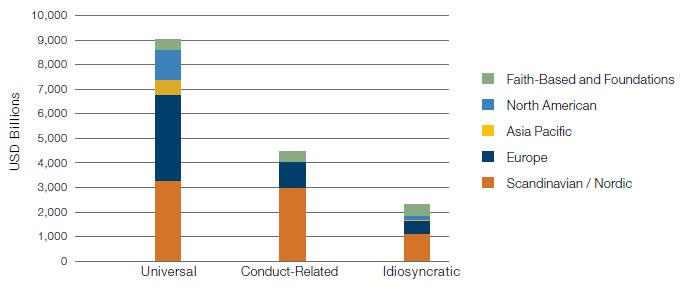
Source: Man Group; as of 31 December 2019.
Based on data aggregated from public websites, public filings, press releases and other private sources. This information is based on an internal analysis of the data sources listed and may not be complete. Further information available upon request.
Impacts of Common Restrictions
What percentage of the stock market is associated with these exclusionary themes? The number doesn’t look huge at first glance. Taking the Man Universal List as an example, historically, these traditional exclusion list stocks have made up roughly 2.8% of the MSCI World market capitalisation. However, the impact is not negligible considering the volume of assets with restrictions on these names. Also, restrictions will result in an underweight versus the benchmark and are an implicit short if excluded from long-only portfolios.
From an investment return perspective, what is the impact of applying popular ESG exclusionary themes on the portfolio? Figure 3 compares the long-term historical performance of Man Group’s universal restriction list and three popular exclusionary themes versus the MSCI World Index.
Since 2000, portfolios made up of restricted stocks, with the exception of coal, have delivered better performance than the benchmark, suggesting that applying the restriction has probably hurt investment performance. However, it’s worth noting that the return gap has been narrowing in recent years. A look at the individual themes shows a mixed performance. Tobacco stocks, in particular, have seen a dramatic regime shift. Those stocks posted massive outperformance in the first dozen years of the series, and after treading water in the middle of the decade, have significantly lagged the index over the last three years. Nuclear stocks continue to deliver strong relative performance versus the benchmark, while coal and associated stocks continue to underperform.
Figure 3. Cumulative Alpha of Exclusionary Themes Versus MSCI World
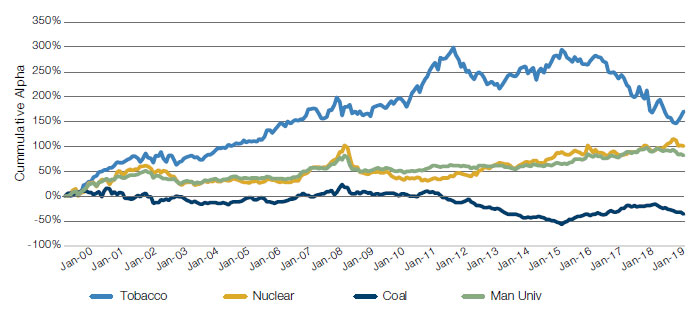
Source: Man Restriction List, MSCI World Index, GICS; as of 31 December 2019.
Past performance is not indicative of future results. Returns may increase or decrease as a result of currency fluctuations. Note: Tobacco portfolio as defined by the tobacco GICS industry; Nuclear weapon portfolio as defined according to Man Group’s restriction list excluding Boeing and Airbus; Coal miner and electric utilities portfolio as defined by the coal and consumable fuels and the electric utilities GICS subindustry. Performance is gross of any fees or expenses and should be considered hypothetical. Please see the end of this paper for additional important information on hypothetical results.
What Has Been Driving the Performance?
A very natural question for us to ask is whether the outperformance of restricted stocks was driven by better fundamentals or other factors. To address this, we created a capweighted portfolio of tobacco stocks that are constituents of the MSCI World Index and looked at how its risk profile has evolved through time in comparison with that benchmark. Figure 4 plots the portfolio’s exposure of four Barra risks factors relative to the index. As you can see, historically, tobacco stocks tended to have lower beta and higher yield than the benchmark. On average, they were also more profitable and higher quality than the benchmark, although these measures have deteriorated recently as tobacco companies have increased leverage.
Notably, these qualities happened to have been favoured by the market over the last decade. Post the Global Financial Crisis, central banks around the globe have taken the ‘lower for longer’ approach to keep interest rates at near-zero, or in some cases, negative levels. Against this macro backdrop, high-yielding stocks, including tobacco companies, were favoured by investors who coveted yield.
Meanwhile, the lengthened bull market has prompted investors to seek a more defensive posture and low volatility strategies have been one of the biggest beneficiaries. Figure 5 shows that low volatility ETFs have received significant inflows as the market has risen in recent years. Tobacco stocks, with their persistent low beta exposure, are ideal candidates for such strategies in our view.
Figure 4. Exposure to Barra Risk Factors (Tobacco Stocks Versus MSCI World)
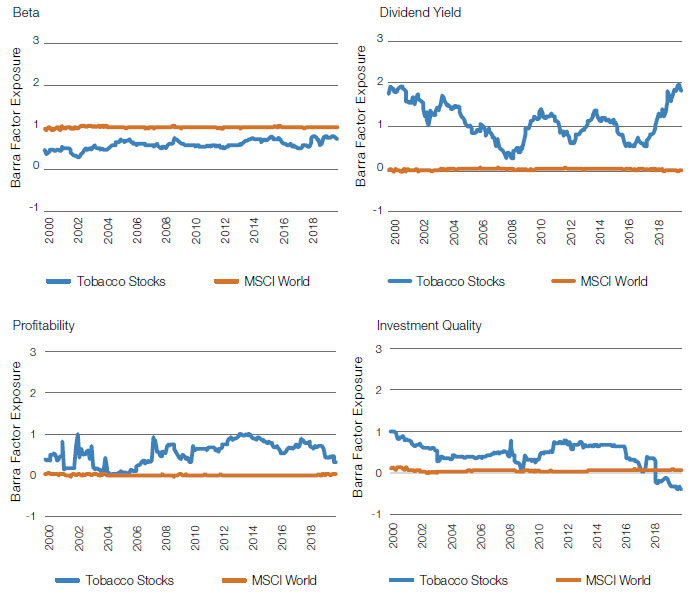
Source: Barra risk model, MSCI World Index; as of 31 December 2019.
Portfolio results should be considered hypothetical. Please see the end of this paper for additional important information on hypothetical results.
Figure 5. Low Volatility ETFs Saw Sustained Fund Flows
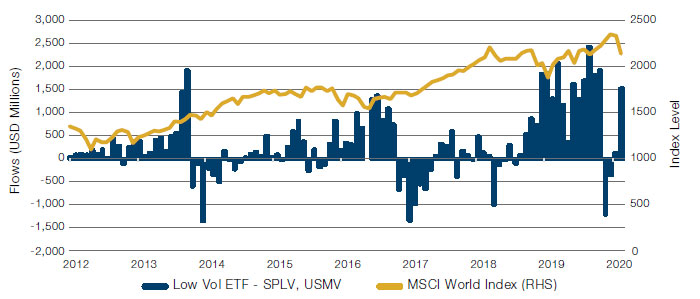
Source: Bloomberg; as of 31 December 2019.
As a next step, we looked at the relative performance of restricted stocks after adjusting for these qualities. In this analysis, we regressed stock return against size beta, momentum, yield, profitability and investment quality, and then took the residual from regression as the risk-adjusted return. Figure 6 shows that all the restriction categories, with the exception of nuclear stocks (which have more balanced exposure to the risk factors), have produced dramatically lower excess returns over the period after adjusting for the ‘in-favour’ factors. This confirms our conjecture that the superior performance of restricted stocks is in part due to their exposure to risk factors favoured by the market.
Figure 6. Risk Adjusted Returns of Restricted Stocks Versus MSCI World
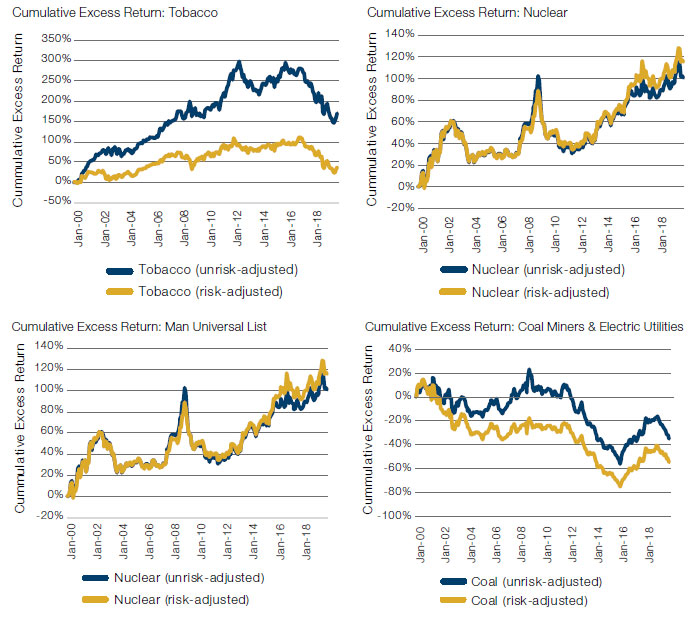
Source: MSCI World Index; GICS; as of 31 December 2019.
Performance is gross of any fees or expenses and should be considered hypothetical. Please see the end of this paper for additional important information on hypothetical results.
This could mean that the performance of restricted stocks might be dubious in the future if the risk factors to which these stocks are exposed, go out of favour as the market environment shifts. In fact, the gap in returns between risk-adjusted restriction categories and the benchmark has already widened. Tobacco stocks, for example, have increased their exposure to Barra Value, suggesting that they are becoming cheaper than before (Figure 7).
Figure 7. Tobacco Stock Exposure to Barra Value Factor
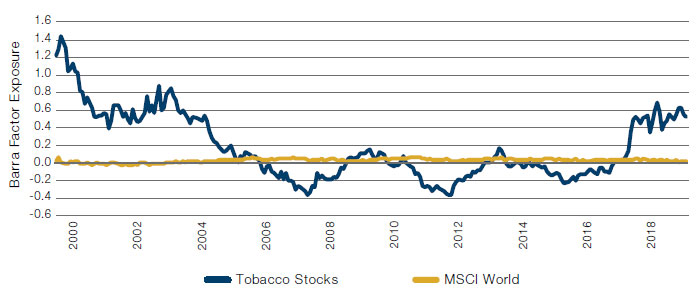
Source: Barra risk model, MSCI World Index; as of 31 December 2019.
Portfolio results should be considered hypothetical. Please see the end of this paper for additional important information on hypothetical results.
Some may argue that these cheap valuations imply higher future returns and that the popularity of ESG-oriented strategies is creating a profitable opportunity from divestment activities. These views may be short-sighted. These stocks are subject to idiosyncratic risk arising from backward-looking valuation. A telling example is Altria Group, which in January 2020, took a USD4.5 billion write-down on its investment in e-cigarette company Juul after facing increased pressure from regulators. These writedowns have also occurred in resource-oriented companies like coal and oil and are worth scrutinising. This is a reminder that valuations (and potential future opportunities) of stranded assets may be overstated and stocks that appear to be cheap may just be the market’s anticipation of the inevitable write-down.
Overall, this analysis highlights the importance of evaluating the inherent biases of any strategy and adjusting for them in analysing returns. When it comes to implementing ESG strategies, it is particularly dangerous to myopically focus on solely the ESG aspects of a company. A holistic view is needed to fully understand all the underlying factors driving stock return.
Impact of Divesting Restricted Companies
As institutional investors divest from negative ESG companies, there are growing concerns about the potential drag on portfolio performance caused by outflows. Here, we use the divestment of tobacco stocks to measure the impact. We first aggregate total assets managed by large global asset owners and their exclusion list. Man Group estimates that USD7.34 trillion of AUM have tobacco-specific restrictions. This estimate was based on the same sources used in Figure 2. Tobacco’s weight in the MSCI World Index is roughly 1%. Assuming the aggregate holdings by large asset owners to be similar to the benchmark, we then map the aggregate AUM to the MSCI Index to obtain weights and holdings of relevant tobacco stocks. Lastly, we leverage on Man Group’s proprietary transaction cost model to measure the trade cost associated with different scenarios of divestment progression and time to divest. Our analysis shows that, depending on the timing, divestment can cause a large drag on portfolio performance.
The lines in Figure 8 represent different levels of portfolio holdings in tobacco yet to be divested (i.e. 75% means that the investor has already liquidated 25% of their tobacco holdings and must divest the remaining 75% to be fully divested). The x-axis indicates various durations of time to divest. These range from one to six months. The y-axis shows the trade cost per dollar traded. If assets owners have already divested 50% of their holding in tobacco, the cost for them to divest the remaining half in one month would be 65 basis points (‘bp’) per dollar traded; it would cost 41 bp per dollar traded if divesting was spread over 12 months.
Figure 8a. Flow Effect on Divesting
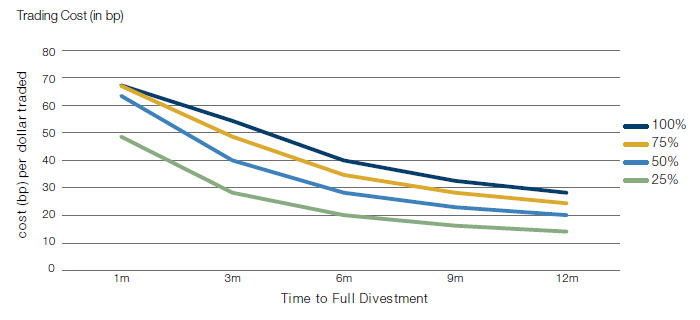
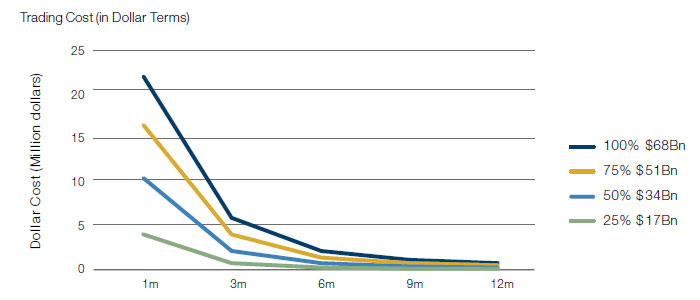
Source: Man Exclusion List, MSCI World Index weight; as of 31 December 2019.
These figures are represent estimated trading costs, based on Man Group models. Other investors may realise different outcomes.
Figure 8b. Trade Cost in Dollar Terms (Million Dollars)
| Assets Needed to Be Divested | |||||
|---|---|---|---|---|---|
| 100% (USD68 Billion) | 75% (USD51 Billion) | 50% (USD34 Billion) | 25% (USD17 Billion) | ||
| Time to Divest | 1m | 22.2 | 16.6 | 10.5 | 4.0 |
| 3m | 6.0 | 4.0 | 2.2 | 0.8 | |
| 6m | 2.2 | 1.4 | 0.8 | 0.3 | |
| 9m | 1.2 | 0.8 | 0.4 | 0.1 | |
| 12m | 0.8 | 0.5 | 0.3 | 0.1 | |
Furthermore, Figure 8b shows the total dollar cost to the portfolio resulting from the impact of divestment by multiplying the trading cost by the total dollars traded. So, if tobacco stocks account for 1% of the MSCI World benchmark weight, the total divestment would be roughly USD68 billion. It would cost asset owners USD22.2 million to divest those stocks in one month and USD2.2 million dollars if they spread the divestment over six months.
Both charts show outflows can have a sizeable drag on portfolio performance. As tobacco stocks included in the MSCI Index have an industry market cap of USD383 billion dollars1, the USD68 billion full divestment in the above calculation only accounts for 18% of the total market cap of the tobacco industry! If investors choose to divest more aggressively, divestment of restricted stocks would result in much greater drag on performance.
Where Else to Turn?
If divesting from these industries does happen, what are some substitute industries we can leverage to replace restricted stocks while keeping their desired qualities?
In this section, we focus on tobacco stocks as they are positively exposed to a few highly desired risk factors: earnings/dividend yield, investment quality and profitability. To find other subindustries that are most similar to tobacco stocks with respect to these qualities, we represent the risk profile of each subindustry with a four-dimensional vector where each dimension corresponds to a risk factor. Then we compute the Euclidean distance between tobacco stocks and all the other subindustries based on their risk vectors.
Figure 9. Subindustries With Closest Euclidean Distance to Tobacco
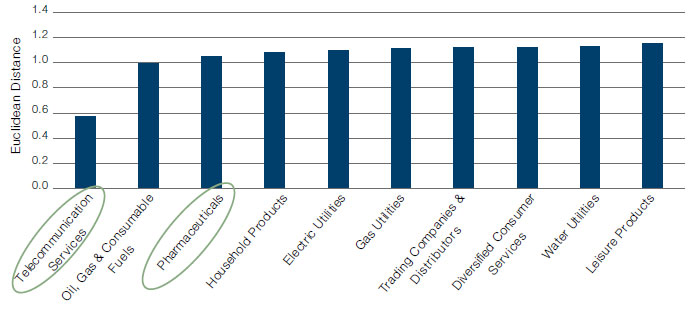
Source: Bloomberg, Man Numeric; as of 31 December 2019.
Figure 9 displays subindustries that are closest to tobacco stocks by the four risk dimensions. Among these, Diversified Telecommunications and Pharmaceuticals stand out as subindustries that are more consistent with the values of an ESG investor than some of the options like Oil, Gas & Consumable Fuels and Utilities (see Figure 10 for detailed risk scores). From a portfolio construction perspective, substituting these stocks for tobacco stocks can potentially preserve the portfolio’s high yield and low volatility feature while enhancing its ESG exposure.
Figure 10. How Does Tobacco Compare With Other Subindustries by Multiple Risk Dimensions?
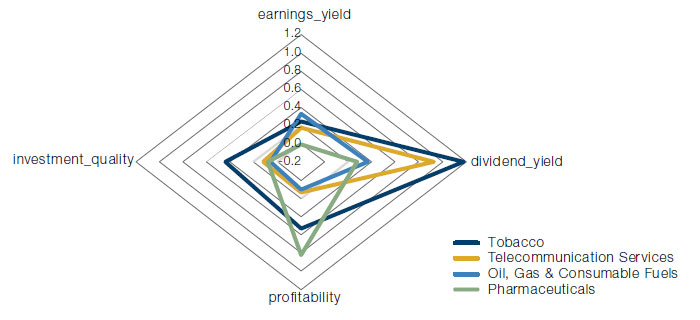
Source: Barra risk model, Bloomberg, Man Numeric; as of 31 December 2019.
Part II: Exploring the Dark Side – Shorting ‘Bad’ ESG Companies
So, common restrictions have underperformed after adjusting for common risk factors. Why not go one step further and actually go short those companies?
When you buy a stock you are indirectly providing capital to the company; if you amass a large enough position, you can influence management behavior. While shorting a stock does not provide capital to the company, it does not mean the investor loses her influence with management. Indeed, investors with large short positions will often gain the attention of corporate officers who try to convince them where their bearish bets are misguided. Management clearly recognises that excessive shorting is bad for their stock price – we as investors should recognise it too, and apply that principle to our ESG investing.
Relaxing the short constraint can potentially bring many benefits to the portfolio. Many academic studies2,3 have shown that relaxing the short constraint allows investors to better express their views and improves Sharpe ratios. Moreover, it is acceptable to go short on the basis of other signals such as overvaluation or low-quality earnings.
Why then don’t we short bad ESG companies? Part of the ESG story is one of risk – poorly ranked ESG companies will be subject to data breaches, higher costs of capital and fines and penalties, which will impair brand value and impact stock prices. Investors should use all available information, even if it is negative, to make their decisions – why not short those companies that are at the most risk? One answer is that many asset owners don’t want these stocks even showing up on their asset holdings lists, even on the short side. We believe there are two reasons for this. First, there is concern that once they short the stock, investors will eventually have to buy back these bad ESG stocks in order to cover the short position. Secondly, there is a possibility of press coverage if they show up as having a position. Still, these arguments are not strong enough to convince us.
In this section, we explore the implications of shorting bad ESG companies. We compare the differences between the long-short ESG portfolio and the long-only positive ESG portfolio, from the following three aspects: ESG exposure, return and risk. Our analysis indicated that shorting poorly ranked ESG companies increased a portfolio’s overall exposure to ESG signals. More importantly, there was strong value to be found on the short side across various ESG strategies. In addition, shorting bad ESG firms added additional benefits by lowering portfolio’s overall risk.
Shorting Bad ESG Companies Increases Portfolios’ ESG Exposure and Return
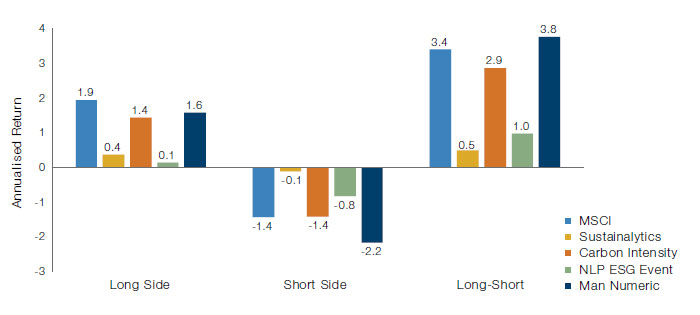
As a first step, we constructed sector-neutral, decile long-short portfolios from a universe of about 4,500 of the most liquid developed market stocks between 1 January, 2013 and 31 December, 2019. Portfolios are formed by longing (shorting) the best (worst) 10% of firms within each sector. Firms are selected based on various ESG characteristics. We examined three broad-based strategies, including two commonly used data vendors (MSCI and Sustainalytics ESG rankings) as well as Man Numeric’s proprietary ESG model. Man Numeric’s proprietary ESG model is based on 15 fundamental ESG pillars, which is sector neutral and is neutral to common factors. We also evaluate performance from the long (short), high (low) carbon efficiency level data from Trucost and an event-driven strategy built by shorting firms associated negative ESG news using natural language processing (‘NLP’) techniques.
By shorting bad ESG firms, one can almost double a portfolio’s overall exposures to ESG factors across all board based ESG strategies, as shown in Figure 11. The sector-neutral decile return (Figure 12) shows that firms that rank poorly based on ESG criteria underperform in the market. Moreover, our analysis indicates that returns were about equal from both the long side and short side of all broad-based ESG strategies, including MSCI, Sustainalytics and Numeric models, as well as the carbon-efficient strategy. NLP news-driven strategies have a stronger return form the short side than the long side.
Figure 11. Shorting Doubles Portfolio’s ESG Exposure
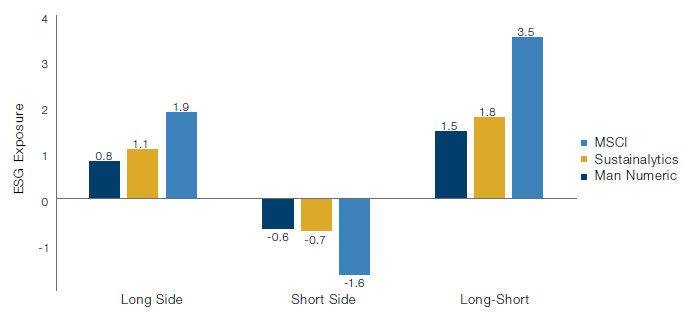
Source: MSCI ESG score, Sustainalytics ESG score; as of 31 December 2019.
Figure 12. Bad ESG Companies Have Underperformed
Source: MSCI ESG score, Sustainalytics ESG score; as of 31 December 2019.
All model spread performance shown is gross-of-fees and does not represent the performance of any portfolio or product. To calculate long-only model spreads, we invest long in the top 10% ranked names within each sector and display the gross of fees return. To calculate long-short model spreads, we invest long in the top 10% ranked names within each sector and are short the bottom 10% ranked names within each sector and display the gross of fee return. These spread returns are instantaneously rebalanced and do not reflect transactions costs. Rankings are based on Man Numeric’s internal Alpha model scores.
Besides enhancing portfolio ESG exposure and boosting returns, shorting poor ESG firms offers other added benefits. Analysis of the Barra factor exposures of the long and short sides of the portfolios ranked on Man Numeric proprietary ESG scores illustrated that betting against bad companies greatly reduces portfolios’ risk and lowers the drawdown. As shown in Figure 13, we found that though both groups have lower residual volatility than the overall universe, the stocks with good ESG scores have much less residual volatility exposure. Moreover, poorly ranked ESG firms have much lower investment quality, lower earnings quality and lower profitability.
Figure 13. Portfolio Exposure to Barra Risk Factors, Bucketed by ESG Scores
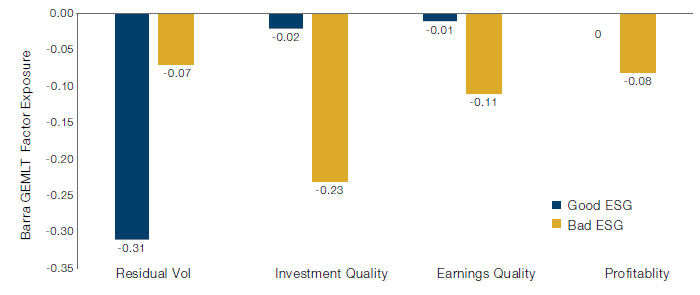
Source: Barra risk model, Man Numeric; as of 31 December 2019.
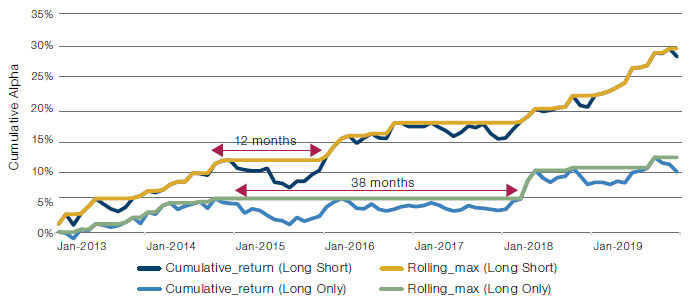
We further compared the drawdown patterns of long-short portfolio and long-only portfolio. Figure 14 shows the cumulative returns from 2013 to 2019 for both portfolios. First, we found that the long-short portfolio is able to realise more than double the cumulative return compared with the long-only portfolio at the end of 2019. From 2015 to 2016, both portfolios experience drawdowns, with the maximum peak-totrough decline of about 4.3% for the long-short portfolio, while the long-only portfolio has a 4.1% drawdown. Though the long-only portfolio has a slightly lower absolute drawdown, it takes the long-only portfolio more than three years to exceed the prior peak level, while it only takes a long-short portfolio only 12 months to recover the loss and achieve a higher level of returns. In historical simulations, shorting poor ESG companies has allowed portfolios to achieve a higher exposure to ESG signals and realise higher returns, as well as lowering overall risk exposure and drawdown. Thus, it is natural to ask: why not profit from both good and bad companies, especially if those companies are not friendly to the environment, employees or shareholders?
Figure 14. Long-Short Portfolios Are More Resilient Than Long-Only Portfolios
Source: Bloomberg, Man Numeric; Between 1 January 2013 to 31 December 2019.
Performance is gross of any fees or expenses and should be considered hypothetical. Please see the end of this paper for additional important information on hypothetical results.
Shorting Bad ESG Companies Helps Fiduciary Obligation
A clear case can be made that shorting bad ESG companies is consistent with the fiduciary obligation of the asset advisor/manager. As discussed above, betting against companies that rank poorly on ESG issues has enhanced risk-adjusted returns in both historical simulations and out-of-sample periods. A fiduciary is charged with acting in the best interest of the party whose assets they are managing and must do so in good faith and trust. If higher returns with lower drawdowns allows retirees to live more comfortably, universities to offer more generous financial aid or foundations to fund more charitable projects, then shorting starts to look like a requirement. In fact, if the manager is prohibited from shorting bad companies, they might be shirking their obligation as a fiduciary and could make the beneficiaries less well off. Relaxing the short constraint is even more important if the responsible investor has other limitations placed upon them like restriction lists or carbon budgets. Allowing shorts can help recover some of the degrees of freedom lost from other ESG constraints.
Conclusion
For some reason, when it comes to responsible investing, very few investors and hedge funds wish to discuss shorting. It is as if we are shying away from dealing with the logical implications of responsible investing: that by only being long firms which meet our ESG criteria and applying a restricted list, we implicitly take one of two views: 1) that we are prepared to sacrifice performance for moral rectitude; or 2) we believe firms who have good ESG performance will (vastly) outperform peers, so there is no need to focus on exploiting the poorly ranked companies.
The truth is if we take the latter stance, it makes no sense, in our view, not to short stocks whose poor ESG practices leave them with a higher cost of capital, less productive employees, or facing more onerous regulatory burdens due to their environmental practices.
“But truth is like poetry,” as Mark Baum mentioned in The Big Short, “…and most people f*****g hate poetry.”
Still, as we have demonstrated, the concept of shorting stocks on an ESG basis makes intuitive sense: it increases a portfolio’s exposure to ESG signals, the potential for delivering alpha and the speed of recovery from drawdowns. Furthermore, it allows portfolios to properly capture the value of a growing risk: the risk that companies fail to deal with the transition to more responsible models of operating, overstating the value of potentially stranded assets and failing to account correctly for the ESG risks to which their businesses are exposed.
More importantly, however, going short marks the evolution of responsible investment from a more passive approach (that just excludes stocks based on a categorical restriction list) to a more active approach that uses all available information to fully reflect their views in their positioning. No longer should ESG considerations be siloed. We accept shorting as a key tool of investment management for every other asset class and style; why not use it in responsible investing as well?
1. As of 31 December, 2019.
2. Richard C. Grinold and Ronald N. Kahn; 2000; “The Efficiency Gains of Long-Short Investing”; Financial Analysts Journal, vol. 56, no. 6 (November/December): 40-53.
3. Steven Thorley, Roger Clarke and Harindra de Silva; 2001; “Portfolio Constraints and the Fundamental Law of Active Management”; Financial Analysts Journal, 58.10.2139.
You are now exiting our website
Please be aware that you are now exiting the Man Institute | Man Group website. Links to our social media pages are provided only as a reference and courtesy to our users. Man Institute | Man Group has no control over such pages, does not recommend or endorse any opinions or non-Man Institute | Man Group related information or content of such sites and makes no warranties as to their content. Man Institute | Man Group assumes no liability for non Man Institute | Man Group related information contained in social media pages. Please note that the social media sites may have different terms of use, privacy and/or security policy from Man Institute | Man Group.