In this week’s edition: why we’re watching the Sahm Indicator; and are bond extremes flashing a sell signal?
In this week’s edition: why we’re watching the Sahm Indicator; and are bond extremes flashing a sell signal?
July 16 2019
The Sahm Indicator
Economist Claudia Sahm posits that when the US 3-month average unemployment rate rises by at least 50 basis points relative to its previous 12-month low, the US economy has entered a recession. The ‘Sahm Indicator’ has proved to have considerable robustness – it has correctly identified every recession since 1970 with no false positives (Figure 1).
We highlight the Sahm Indicator because we are seeing an uptick in the US unemployment rate, from a low of 3.6% at the end of May to 3.7% at the end of June.1 Whilst this leaves us 40bp away from the 4.1% threshold that would trigger the indicator, we still believe it’s worth watching.
One might initially think that 4.1% unemployment is not a particularly big deal – after all, it would be a low reading in historical terms. However, we believe that what matters is not the level of initial reading, but instead the rate at which unemployment increases. A June paper by the Hamilton Project highlighted that between November 2000 and June 2001, unemployment rose from 4% to 4.5%. Both readings would be low in terms of historic unemployment figures, yet a recession still occurred.
Figure 1: The Sahm Recession Indicator
Unemployment Rate (3-Month Average) Relative to Prior 12-Month Low
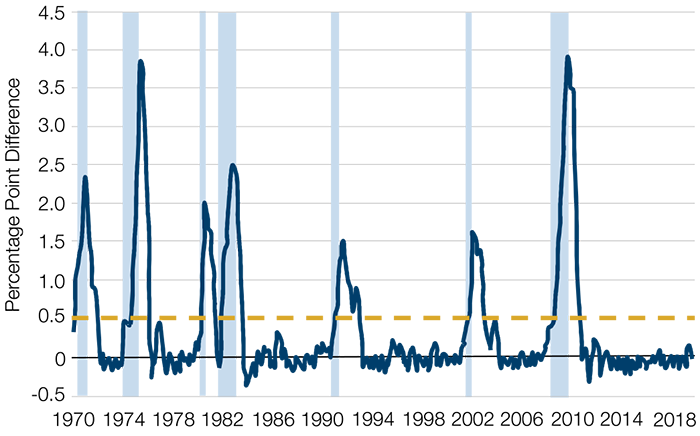
Source: Current Population Survey, Bureau of Labor Statistics 1970-2019; Sahm 2019.
Shaded area denotes recessions. Dashed line denotes proposed recession indicator threshold of 0.50.
Bond Extremes – Volatility and Liquidity
Rising bond market realised volatility (Figure 2) and tightening liquidity (Figure 3) may be signalling a potential bond market tantrum. In our view, the current situation is reminiscent of the build-up to previous bond market wobbles in April 2013, October 2014 and April 2015. A back-up in yields would also be consistent with our previous analysis of market moves during precautionary rate cutting cycles.
We are currently at the 99th percentile in terms of returns; indeed, the JPM USD Global GBI 3-month annualised performance (of 17%, Figure 4) and Sharpe ratio (of 7x, Figure 5) are close to post-Lehman extremes. From this point on, our analysis indicates that this is a sell signal with a 71.2% probability of negative returns.
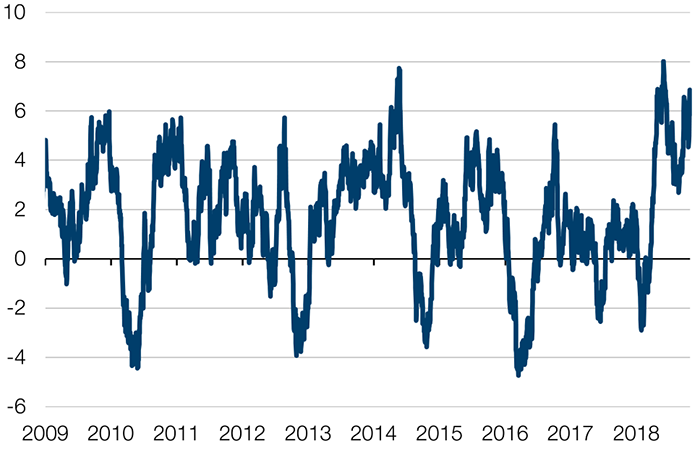
Figure 2: Three-Month Annualised Daily Volatility, US Treasuries
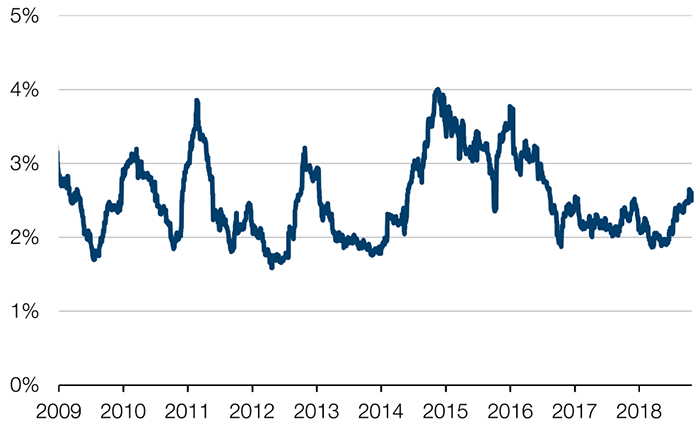
Source: Bloomberg, Man Group; as of 5 July, 2019.
Figure 3: Ten-Year UST Futures, Size of Tightest Three Bids and Asks Each Day in Number of Contracts
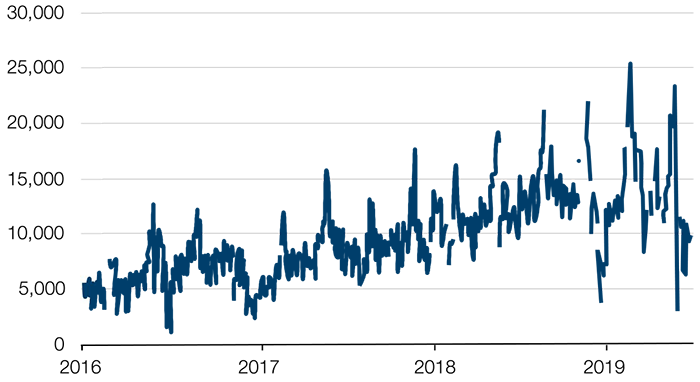
Source: JPMorgan; as of 5 July, 2019.
Figure 4: Three-Month Annualised Returns, JPMorgan GBI Global USD Index
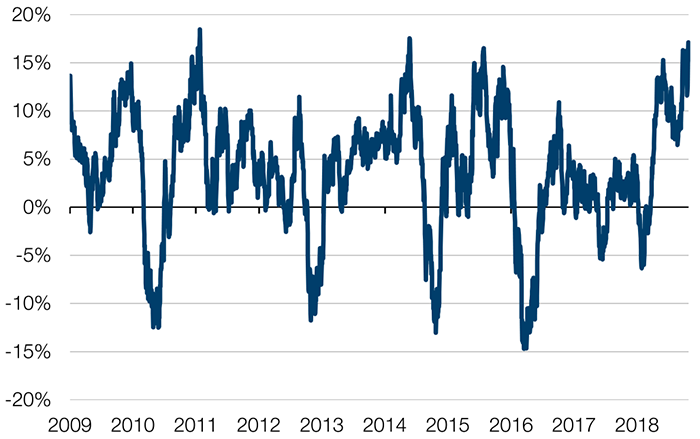
Source: Bloomberg, Man Group; as of 5 July, 2019.
Figure 5: Three-Month Annualised Sharpe Ratio, JPMorgan GBI Global USD Index
Source: Bloomberg, Man Group; as of 5 July, 2019.
Air Supply
One early warning of Federal Reserve cuts to come is the supplier deliveries component of the US manufacturing purchasing manufacturers index (‘PMI’). The component measures purchasing managers’ perception of whether their suppliers are servicing them more or less efficiently: above 50 means they’re getting more efficient and vice versa. Qualitatively, the metric is a good gauge of how slickly the economy is running. Suppliers may stutter for any number of reasons – e.g. lack of skilled labour, restrictive access to credit, aging capital stock etc. – but when they do, our prior is that the Fed will be quick to grease the wheels with monetary accommodation.
There is some quantitative support for this theory: in Figure 6, we shade in blue the periods where supplier deliveries was under 50 for two consecutive months or more. In Figure 7, we detail what happened to the base rate around that point. Nothing happened in the last three instances, but that’s not surprising: there was nothing left to cut. In all of the other instances, cuts quickly followed – often simultaneously it must be admitted, but usually in a protracted manner.
So, we’re watching the indicator quite closely at the moment: at 50.7 as of June 2019, it’s not yet breaching the rule, but it’s fallen rapidly from a peak of 67.6 12 months ago.
Figure 6: Supplier Deliveries and the Fed Funds Rate
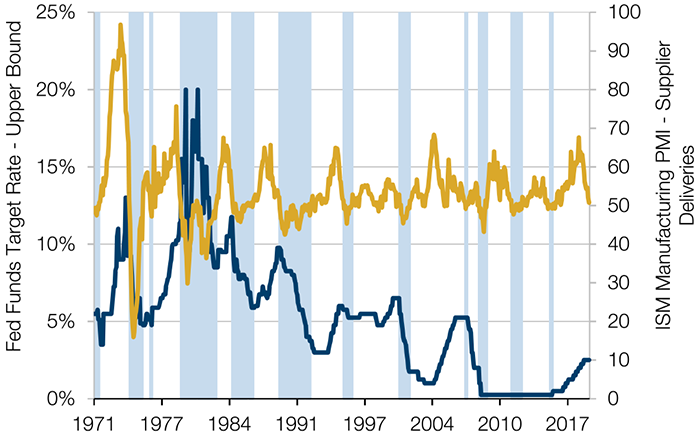
Source: ISM, Bloomberg, Man Solutions, as of 28 June, 2019. Shaded areas are where Supplier Deliveries are below 50 for two consecutive months or more.
Figure 7: Instances of Two or More Consecutive Supplier Deliveries Readings of 50 or Less
| Period | Federal Funds Target Rate Impact |
|---|---|
| March 1971 – September 1971 | Cut from 5.13% to 3.50% between September 1971 to December 1971 |
| October 1974 – December 1975 | Cut from 8.0% to 4.75% between December 1974 to January 1976 |
| October 1976 – November 1976 | Cut from 5.13% to 4.75% between September 1976 to November 1976 |
| October 1979 – March 1981 | Mixed alternating cuts (5) and hikes (6). Goes from 15.5% to 16.0% between December 1979 and January 1981 |
| June 1981 – February 1983 | Mixed alternating cuts (9) and hikes (2). Goes from 15.5% in June 1981 to 8.5% in December 1982 |
| October 1984 – February 1986 | Mixed alternating cuts (7) and hikes (2). Goes from 10.0% in October 1984 to 7.75% in December 1985 |
| June 1986 – September 1986 | Cut from 6.88% to 5.88% between June 1986 to August 1976 |
| May 1989 – September 1991 | Cut from 9.63% to 5.25% between June 1989 to September 1991 |
| December 1991 – April 1992 | Cut from 4.75% to 3.75% between November 1991 to April 1992 |
| August 1995 – May 1996 | Cut from 5.75% to 5.25% between November 1995 to January 1996 |
| January 2001 – December 2001 | Cut from 6.50% to 1.75% between December 2000 to December 2001 |
| June 2007 – July 2007 | Cut from 5.25% to 2.0% between August 2007 to April 2008 |
| October 2008 – June 2009 | Cut from 2.0% to 0.25% between September 2008 to December 2008 |
| December 2011 – April 2012 | None |
| July 2012 – November 2012 | None |
| September 2015 – November 2015 | None |
Source: Man Solutions; as of 28 June, 2019.
With contribution from: Ed Cole (Man GLG, Managing Director) and Henry Neville (Man Solutions, Analyst).
1. Bloomberg.
You are now exiting our website
Please be aware that you are now exiting the Man Institute | Man Group website. Links to our social media pages are provided only as a reference and courtesy to our users. Man Institute | Man Group has no control over such pages, does not recommend or endorse any opinions or non-Man Institute | Man Group related information or content of such sites and makes no warranties as to their content. Man Institute | Man Group assumes no liability for non Man Institute | Man Group related information contained in social media pages. Please note that the social media sites may have different terms of use, privacy and/or security policy from Man Institute | Man Group.