Does the Chinese equity selloff provide a buying opportunity? And is inflation good news for quant investing?
Does the Chinese equity selloff provide a buying opportunity? And is inflation good news for quant investing?
August 3 2021
China: A Contrarian Buying Opportunity?
Chinese equity indexes have had a few volatile days triggered after a ban on swathes of the tutoring industry from making profits sparked concerns that other industries could be affected. But is now actually a good time to buy – or should investors stay on the sidelines?
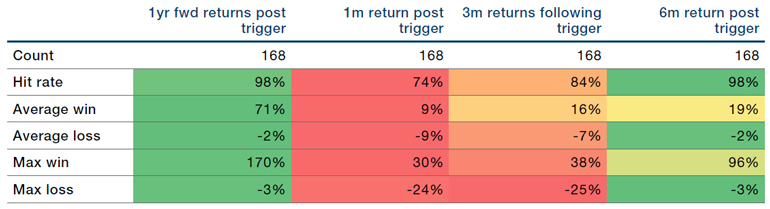
To help answer that questions, we looked at the NASDAQ Golden Dragon China index, an offshore index mainly comprised of US listed Chinese tech firms. The index has started to give capitulation signals, which we quantify as periods of extraordinary clustering of negative price changes (Figure 1). The 1-month, 3-month, 6-month and 1-year forward returns after our capitulation signal is triggered are positive, with hit rates of 74%, 84%, 98% and 98%, respectively. Indeed, the longer one holds a position after the capitulation, the better the average upside.
Still, four things to note: first, we’ve only had one capitulation signal so far, while history has shown that the signals tend to cluster. Second, this capitulation signal has appeared in the NASDAQ Golden Dragon China index, but not yet in any of the local Chinese indexes. Third, this analysis ignores the material earnings risk that a stricter regulatory environment poses to a tech sector widely held by a pool of global investors who are learning the hard way about emerging market risks. Fourth, the onshore stock of margin loans is at its highest level since the A-share bubble of 2015 (Figure 2). In essence, this means that if selloffs continue, many of the debt-funded equity positions will receive margin calls, exacerbating the negative momentum.
So, while the risk-reward may be starting to get better in China, we wouldn’t necessarily be rushing in to buy at the moment.
Figure 1. Nasdaq Golden Dragon China Index (Log Scale) – Capitulation Signals
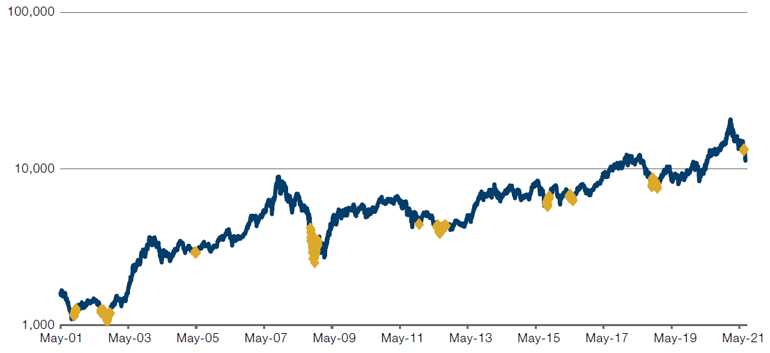
Source: Man GLG; as of 27 July 2021.
Problems loading this infographic? - Please click here
Source: Bloomberg; as of 2 August 2021.
Inflation Through a Quant Factor Lens
Is inflation good for quant investing?
Figures 3-4 display the average performance of several classic quant factors in various CPI environments.
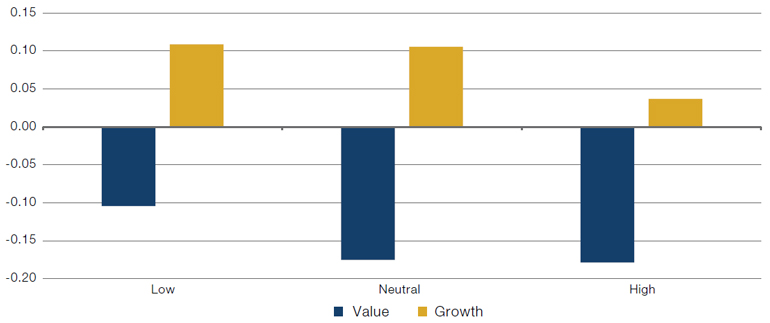
Generally speaking, high inflationary regimes – with year-over-year CPI above 2.5% – are a boon for shorter duration assets and a detractor for longer duration ones. Intuitively, this makes sense: the further into the future a firm’s cash flows are expected to materialise, the more of an opportunity inflation has to eat into them. Thus, in higher inflation environments, factors that favour good earnings and cash flows today – such as Value and Profitability – outperform (Figure 3).
High Growth stocks are on the opposite end of the spectrum. They have much longer durations as they are still growing towards their peak earning potential. For such stocks, inflation is a strong headwind.
In environments where inflation is neutral – defined as year-over-year CPI regimes between 1.5-2.5% – we see a reversion of this pattern. Investors focus less on the timeliness of firms’ payoffs and trade up Growth stocks which offer large, if delayed, returns rather than less exciting value names (Figure 4).
Momentum is more difficult to nail down since the types of firms that investors pile into can vary. On average, Momentum is negatively correlated with Value and positively correlated with Growth. However, in high inflationary periods, the positive correlation between Growth and Momentum drops (Figure 5).
Problems loading this infographic? - Please click here
Source: Bloomberg, MSCI Barra; between January 1996 and May 2021.
Problems loading this infographic? - Please click here
Source: Bloomberg, MSCI Barra; between January 1996 and May 2021.
Figure 5. US Barra Momentum Rank Correlation with Value and Growth in Different Inflation Regimes
Source: Bloomberg, MSCI Barra; between January 1996 and May 2021.
The great tragedy of any quantitative analysis is that it is only as good as the data it is based on. Thus, our low inflationary regime analysis requires a bit more delicate handling. In the time period we analyse, there are two low inflation periods (defined as YoY CPI below 1.5%) – of which the longest and most dominant of these is the post-Global Financial Crisis (‘GFC’) period. The dominance of this event in the data paints our understanding of lower inflationary environments with some nuances unique to that particular crisis, or at least most exemplified by it.
First, we see a sharp drawdown in Momentum and Value outperformance. In quick market reversions – such as that experienced in 2008 – Momentum is bound to underperform. Momentum stocks, by definition, continue rising upwards during bull markets. Thus, if the market suddenly turns, they are likely to underperform. Value stocks on the other hand are, by definition, those which the bull market does not fully appreciate and, therefore, benefit from a change in market preferences.
Problems loading this infographic? - Please click here
Source: Bloomberg, MSCI Barra; between January 1996 and May 2021.
What About Beta?
The factor notably absent from our discussion so far is Beta. In the high and normal inflationary regimes, Beta behaves quite similarly to Growth. Higher Growth stocks are typically higher Beta as well. Indeed, between January 1996 and June 2021, they have a rank correlation of approximately 20% on average, but reaching as high as 70% in the late 1990s and early 2000’s.
Beta names, however, outperform all other categories. This unexpected divergence arises from the unique circumstances of the GFC, which began as a crash in the housing market and extended into a near collapse of the financial system. Both real estate and financials happen to be two of the lowest Beta sectors. Thus, the outperformance of Beta in this environment is less a tale of outperforming high Beta stocks than of underperforming low Beta ones.
Figure 7. US Average Beta by Sector
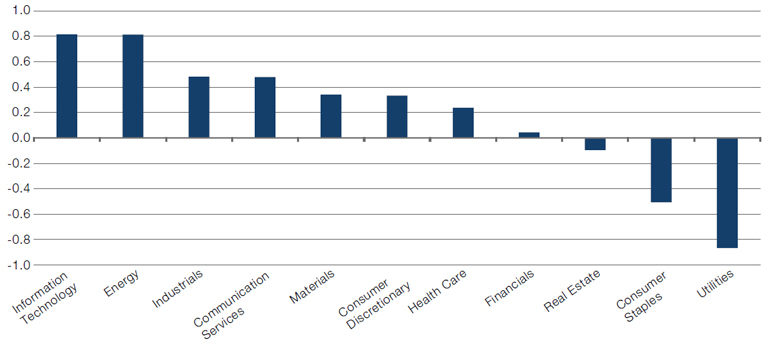
Source: GICs, MSCI Barra; between January 1996 and June 2021.
With contributions from: Ed Cole (Man GLG, Managing Director – Discretionary Investments) and Nina Gnedin (Man Numeric, Associate Portfolio Manager).
1. Barra factor performance shown is long/short quintile factor spreads, where we invest long in the top 20% and short the bottom 20% ranked names (rankings based on each Barra factor exposure) and display the gross return. These spread returns are instantaneously rebalanced, sector-neutral and do not reflect transactions costs. Note the Barra Value is a combination of Barra Earnings Yield, Barra Dividend Yield and Barra B/P. E/P is a Man Numeric calculation.
You are now exiting our website
Please be aware that you are now exiting the Man Institute | Man Group website. Links to our social media pages are provided only as a reference and courtesy to our users. Man Institute | Man Group has no control over such pages, does not recommend or endorse any opinions or non-Man Institute | Man Group related information or content of such sites and makes no warranties as to their content. Man Institute | Man Group assumes no liability for non Man Institute | Man Group related information contained in social media pages. Please note that the social media sites may have different terms of use, privacy and/or security policy from Man Institute | Man Group.