What does uncomfortable inflation levels, along with extraordinarily high GDP numbers, mean for fixed income markets?
What does uncomfortable inflation levels, along with extraordinarily high GDP numbers, mean for fixed income markets?
March 9 2021
Coming Soon: Stress in Fixed Income Markets
A market proxy for the anticipated annual inflation rate for the next half-decade – the 5-year US breakeven rate – exceeded 2.5% for the first time since 2008 last week. Indeed, we estimate that core PCE (illustrated by blue dots) will reach 2.2-2.3% by April, while headline CPI should get close to 3%, purely due to base effects (Figure 1). Independently of base effects, the last two months has seen an additional 0.3% increase across both indices, over and above the increase suggested by historical estimates. Adding 0.3% inflation every two months implies an annualised 1.5% acceleration, on top of the base effect, which could take our estimates for April meaningfully higher.
Separately, the fiscal measures to be passed by the Biden administration add USD1.5 trillion to the USD900 billion of the fiscal package approved in December, resulting in a total USD2.4 trillion. Assuming that 20% of this package is spent in the first quarter, the USD480 billion is equal to 9.6% of quarterly GDP (or 44.3% annualised).
This creates a situation where we could have inflation reaching uncomfortable levels, along with GDP numbers that may appear extraordinarily high. If this doesn’t happen in the first quarter in the event the package is approved too late in March, then it is very likely to happen in the second quarter. We believe this combination could add some stress to the fixed income market as it would be very hard for the long end of the curve to continue to trade implying negative real rates over the long run.
Problems loading this infographic? - Please click here
Source: Man GLG; as of 26 February 2021.
The End of the Bull Market?
The sharp increase in the US 10-year Treasury yield has sounded some alarm bells. Indeed, the rate of change of the increase in rates has been enough that our US Combined Market Timing Indicator has moved swiftly towards ‘sell’ territory, after being deep in ‘buy’. The move is even starker in Europe (Figure 2).
However, does this mean that this is the end of the equity bull market? In short, no. First, even though rates are increasing, they are still incredibly low (Figure 3). Secondly, price-to-earnings multiples keep rising until CPI is around 3% and real rates around 2% (Figure 4). Only when we exceed these bounds do equity multiples start to collapse.
Figure 2. Combined Market Timing Indicator
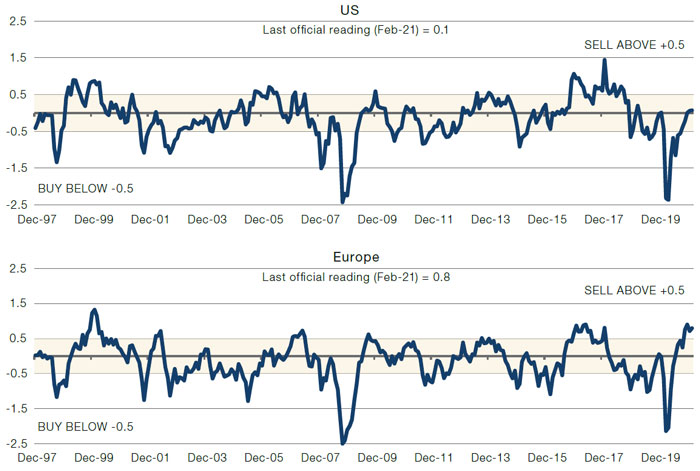
Source: Man Solutions; as of 5 March 2021.
Problems loading this infographic? - Please click here
Source: Bloomberg; as of 26 February 2020.
Figure 4. PE Multiples Versus CPI and Real Rates – Since 1958
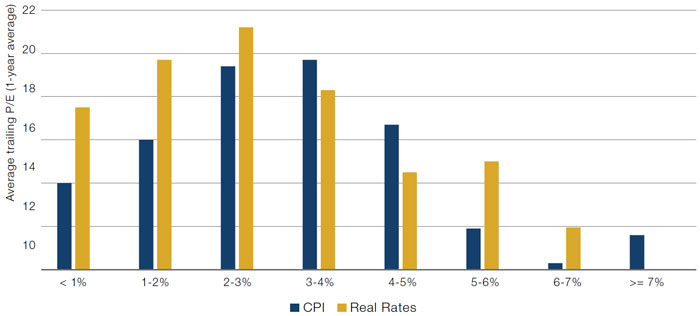
Source: Morgan Stanley, Shiller; as of 2021.
Note: CPI is 3m moving average, real rates is nominal yield minus CPI.
Factor Vol and Changing Regimes
Elevated factor volatility has caught our attention again this past week.
Figure 5 shows the weekly returns to a long/short US Momentum basket, as defined by Morgan Stanley, since 1999. There is currently a clustering of outsized moves, similar to those seen after the dotcom bubble and the Global Financial Crisis. Figure 6, which shows realised volatility in long/short Momentum, shows similar spikes during the dotcom bubble and the GFC. Both of these periods of increased volatility – of Momentum in particular – has coincided with a change in factor leadership.
This is not to say that every factor regime change is accompanied by massive volatility: there are plenty of examples where this is not the case. However, there are no examples of such high levels of volatility without a regime change. If history is anything to go by, this is further confirmation of the signals we have observed for a year now that things are changing in equity leadership.
Figure 5. Weekly Returns, Long/Short Momentum – 1999-2021
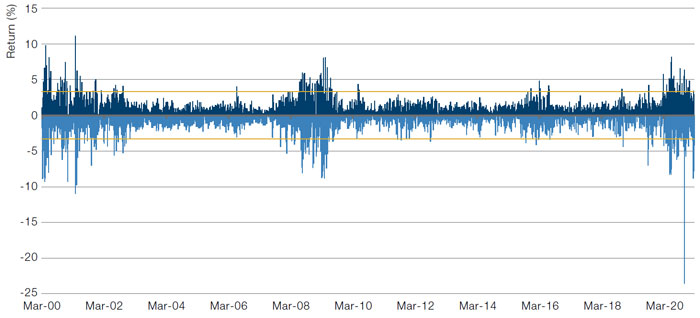
Source: Bloomberg; as of 4 March 2021.
Note: Yellow lines denote 2 and -2 sigma.
Figure 6. Realised Long/Short Momentum Volatility
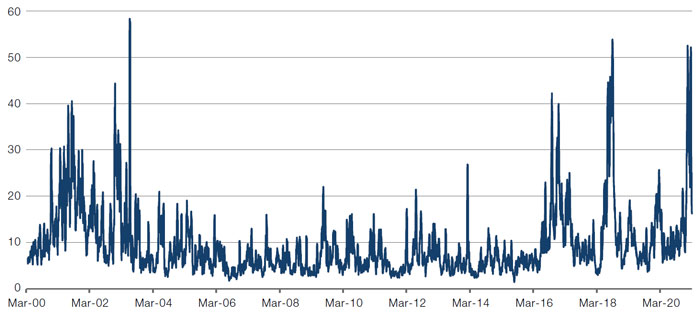
Source: Bloomberg; as of 5 March 2021.
With contributions from: Guillermo Ossés (Man GLG, Head of Emerging Market Debt), Teun Draaisma (Man Solutions, Portfolio Manager) and Ed Cole (Man GLG, Managing Director – Discretionary Investments).
You are now exiting our website
Please be aware that you are now exiting the Man Institute | Man Group website. Links to our social media pages are provided only as a reference and courtesy to our users. Man Institute | Man Group has no control over such pages, does not recommend or endorse any opinions or non-Man Institute | Man Group related information or content of such sites and makes no warranties as to their content. Man Institute | Man Group assumes no liability for non Man Institute | Man Group related information contained in social media pages. Please note that the social media sites may have different terms of use, privacy and/or security policy from Man Institute | Man Group.