How has tech volatility affected the options market?; and the return of animal spirits in M&A volumes.
How has tech volatility affected the options market?; and the return of animal spirits in M&A volumes.
September 8 2020
Quote of the Week:
"It was “Dr Rami” who brought in an ex-special forces guy from Manchester... to work the Wirecard case. He, in turn, reached out to an ex-MI5 counter-terrorism operative... and together they assembled a collection of 28 private investigators to follow me, my colleagues and a baffling array of investors and hedge fund bosses, including Crispin Odey."
Choppy Waters: Persistent Tech Volatility
As the Nasdaq Index hits new highs on the year, call volumes on the top five stocks of the index have dramatically increased from a daily average of USD30 billion notional per day in 2019 to USD110 billion per day by the end of August (Figure 1).
Figure 1. Top Five Nasdaq Stocks - Rolling 1-Month Average Daily Call Volume
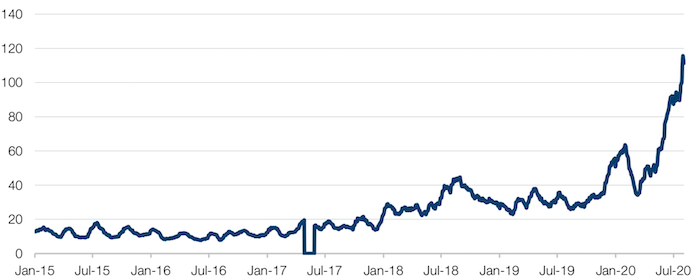
Source: Bloomberg; as of 31 August 2020.
Along with the increase in call volumes has come a dramatic increase in implied volatility for the largest five tech companies and Nasdaq index volatility overall even as broader market volatility has declined over the last couple of months. With the exception of the corona crisis peak in vol, the average 3-month implied vol for those 5 tech companies is above the highs of the last 10 years and 25 points above levels in January despite the market being higher on the year (Figure 2).
Figure 2. 3-Month Implied Volatility – Nasdaq 100, S&P 500 and Average of Top 5 S&P 500 Stocks
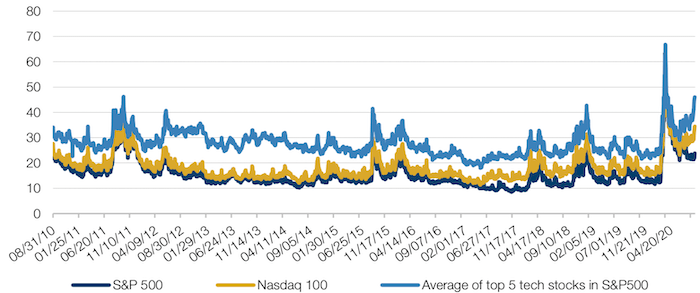
Source: Bloomberg; as of 31 August 2020.
While call buying and hedging may account for the spike in volatility, other factors supporting higher volatility include the parabolic up move in technology stock prices, which leaves options market participants fearful to sell volatility too cheaply, and a dramatic increase in price-to-earnings (‘PE’) multiples. That expansion means that any change in growth prospects may have a larger impact on stock prices than previously experienced. In terms of market implications, heavy call buying and retail flows often “feel” like bearish signals and are used to call for a market top; however, when taken in a longer term context we see some similarities to periods in the mid- to-late 1990s. If we look at a chart of Nasdaq volatility versus S&P 500 volatility over time, while the recent divergence is the largest of the last 20 years, it is not unique. In the late 1990’s, not only did the Nasdaq trade at a larger spread to the S&P 500, it did so during a very sharp up move in late 1999/early 2000. While ultimately, the bubble popped in 2000, using rising volatility in the Nasdaq as a signal that something was amiss in late 1999 would have led investors into trouble, as the Nasdaq stocks continued to run, almost doubling between late 1999 and March 2000. In fact, the Nasdaq volatility did not converge to S&P 500 until valuations declined significantly and multiples converged to broader market multiples.
Figure 3. Nasdaq versus S&P 500, 3-Month Implied Volatility
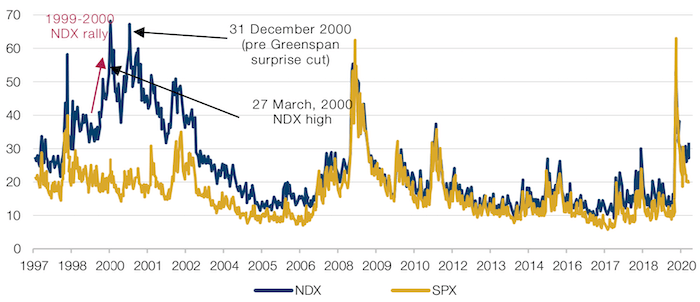
Source: Barclays Research; as of 31 August 2020.
In part because of the move higher in tech vol, S&P 500 implied volatility and the CBOE Volatility Index (‘VIX’) futures have also increased with the market. There has been some discussion in markets as to whether the simultaneous increase in volatility and market levels may also be a sign of an impending correction. Indeed, recent periods when short-dated correlations between the VIX and the S&P 500 have reached 0.5 have presaged subsequent market declines (Figure 4). However, it is worth noting that the same analysis for 1994-2001 showed no predictive value whatsoever (Figure 5).
In short, investors may need to recalibrate their view on volatility going forward. If we are in a period similar to the late 1990s of rising volatility and rising markets, it may have profound implications for short volatility strategies, volatility scaling models and many other portfolio assumptions that we have become accustomed to over the last 20 years. Certainly, the sharp increase in volatility for the top five US stocks should give investors pause with respect to the size of their investments in tech, in our view.
Figure 4. S&P 500 Correlation to the VIX versus Selloffs – 2017-2020
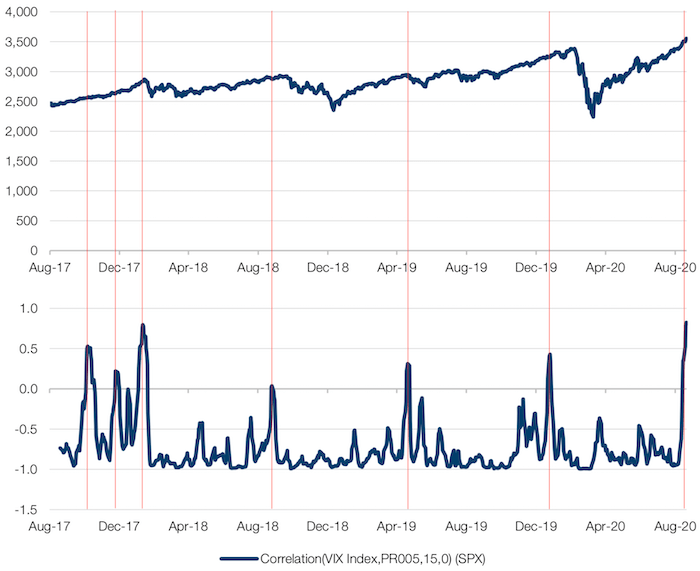
Source: Bloomberg; as of 31 August 2020.
Figure 5. S&P 500 Correlation to the VIX versus Selloffs -1994-2001
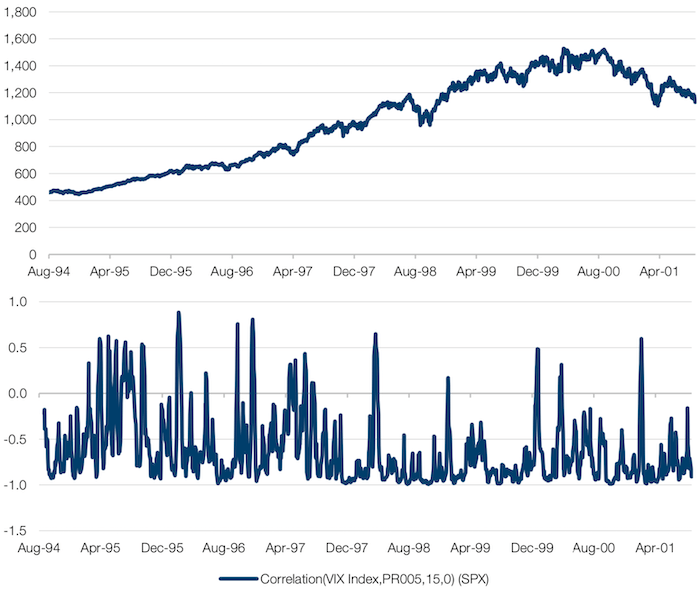
Source: Bloomberg; as of 31 August 2020.
M&A: Animal Spirits Return
One way to measure sentiment in financial markets is by M&A volumes. As we can see from Figure 6, the 20-day moving average of global M&A volumes recovered to around USD16 billion in August, the same level as in March 2020 before the onset of the coronacrisis. Whilst we’ve seen the traditional tail-off as bankers head on their holidays, there a couple of conclusions we can draw from the rise.
Unlike other measures of financial stress such as the level of the US Treasury general account, or basis swap spreads, M&A is something of lagging indicator. Whilst volumes tend to plunge as volatility rises, M&A is much less amenable to the actions of the Fed, and requires a rise in general confidence levels to return to previous levels. Put simply, whilst the Fed can drive down the cost of basis swaps by extending credit lines to foreign central banks, it can’t order companies and bankers to make deals. This is underlined by comparison to other liquidity metrics: whilst swap spreads began to normalise in April, it took until June before M&A volumes started to rise again (Figure 7).
Secondly, it points to a more broad-based sentiment recovery than might be generally thought. Much of the commentary around the equity bounce has focussed on the outperformance of Growth as a factor, and the frenzied participation of retail traders. In contrast, M&A volume growth relies on investment professionals and company boards perceiving expansion opportunities across multiple sectors, rather than being confined to a single factor or sector.
With a such an improvement in animal spirits, it seems to us that we are getting closer to full normalisation of financial conditions.
Figure 6. M&A Volumes - 20-day moving Average (USD billion)
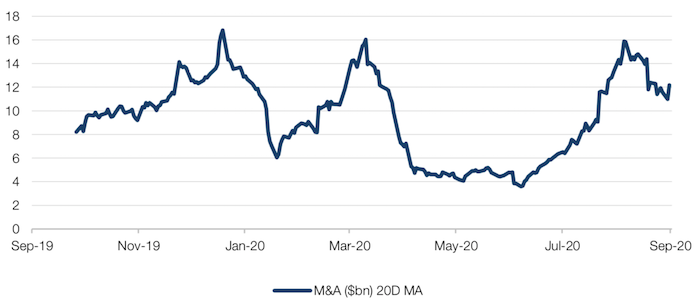
Source: Man Solutions; as of 31 August 2020.
Figure 7. USD LIBOR–OIS versus EUR FRA-OIS
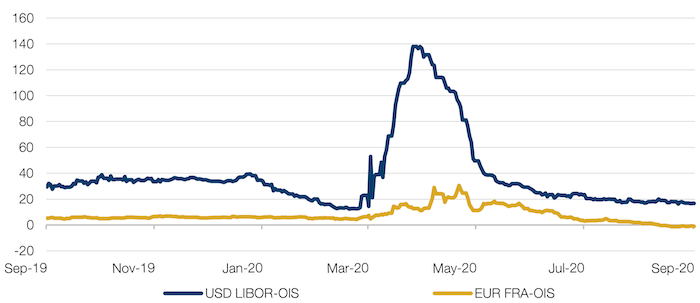
Source: Man Solutions, Bloomberg; as of 31 August 2020.
With contribution from: Peter van Dooijeweert (Managing Director, Man Solutions).
You are now exiting our website
Please be aware that you are now exiting the Man Institute | Man Group website. Links to our social media pages are provided only as a reference and courtesy to our users. Man Institute | Man Group has no control over such pages, does not recommend or endorse any opinions or non-Man Institute | Man Group related information or content of such sites and makes no warranties as to their content. Man Institute | Man Group assumes no liability for non Man Institute | Man Group related information contained in social media pages. Please note that the social media sites may have different terms of use, privacy and/or security policy from Man Institute | Man Group.