Precedent suggests that policy dominates outcomes, and policy is now pro-inflation, especially in the US.
Precedent suggests that policy dominates outcomes, and policy is now pro-inflation, especially in the US.
July 2021
Introduction
In investing, a kneejerk contrarian is more often wrong than right. Equally, above-average performance will not be achieved by being consensual. The best money is made when you have an out-of-consensus view that turns out to be correct. But you have to pick your spots.
In our experience as investors, being in a minority of say 1-in-10, or less, is typically a sign of being a fool; but we have also learned over the years that being in a 1-in-4-or-so minority can be a good omen. Nothing is certain, but that size of minority has a higher likelihood of being correct than a much smaller size.
We note with interest that this is precisely where we find ourselves at this juncture, with respect to inflation. Figure 1 shows that only 1-in-4 investors expect inflation increases to be permanent, as we do. A Bank of America-Merrill Lynch survey had the identical conclusion. We are encouraged.
Figure 1. Deutsche Bank Survey of Whether the Recent Uptick in Inflation Is…
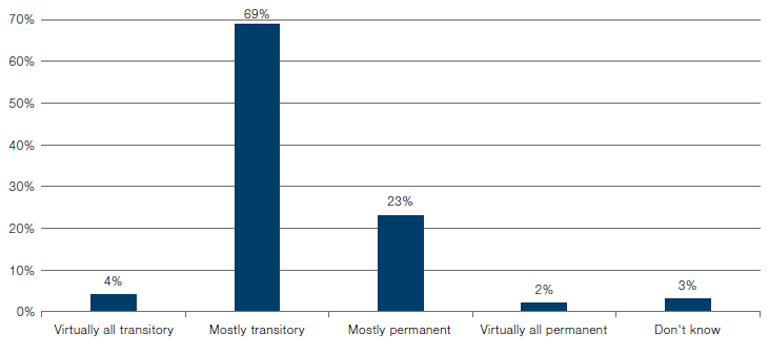
Source: Deutsche Bank Research; as of June 2021.
The reflation trade received a blow after the last FOMC on 16 June. Is it that simple?
Reflation? Stagnation?
The reflation trade received a blow after the last FOMC on 16 June. The Federal Reserve flagged that it may hike rates a couple of times in 2023 as opposed to not at all, and in the immediate aftermath the US dollar rallied, long rates fell and the curve flattened. And the new narrative became that the reflation trade is over. Is it that simple? Was that the turning point that ends the reflation?
We do not think so, but there are some nuances to our thinking. We think this Fed communication was just a tiny tinkering at the margin about what may or may not happen two years from now, and is not significant enough to change things materially. Yes, markets are driven by changes at the margin, but we wouldn’t overstate this change at this particular margin.
But the debate rages on.
In the bear corner, high valuations illustrated, for instance by: a Shiller PE of 37x for US equities and negative real rates globally; a 2nd derivative rollover in lead indicators, revisions, flows and fiscal tightening; rates that are more likely to go up then down; bullish positioning by investors; and a Fed that has started to talk about talking about tapering.
In the bull corner: booming growth as economies re-open while fiscal support is still strong, operating leverage high, and growth typically under-estimated at the early cycle stage; ample spare capacity in the economy witnessed for instance by a high unemployment rate and a low participation rate; policymakers that are intent on keeping the party going; and transitory inflation.
Where do we come out? We think reflation continues despite the likely rollover in lead indicators, we expect inflation to be persistent not transitory, we think that the risk-reward for equities on a 6-month view is skewed negative, and we are more bullish on Value than Growth stocks.
Let’s start with our view on the outlook for equities. Our market timing indicators have served us well over the years, and we are loath to contradict them. We prefer to follow our process, rather than a compelling narrative without a process. And the indicators are as bearish as they get.
Of course, regular readers will not be surprised that the big picture context continues to be that we are in a bull market and have not reached the end of the economic growth cycle yet, in our view.
We are in a bull market and have not reached the end of the economic growth cycle yet, in our view.
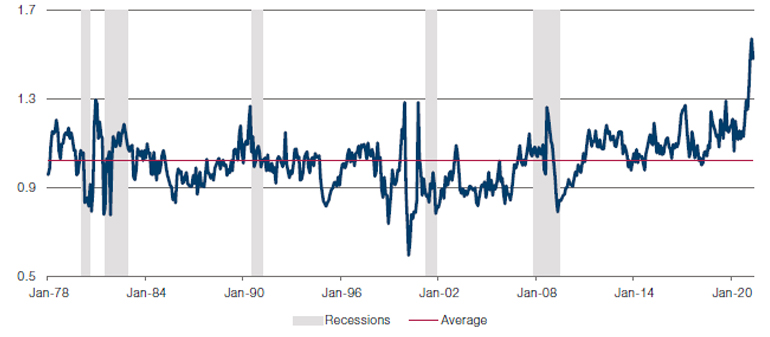
However, the key message of our market timing indicators, based on historical precedent is that there is only a 20% likelihood of up markets in the next six months. Figure 2 shows the Morgan Stanley version of the Combined Market Timing Indicator for Europe, with history back to 1990. This indicator combines a range of fundamental and valuation indicators. The current reading is one of the highest ever, well over one standard deviation above neutral. Historically, as shown in Figure 3, this has meant that markets, over the next six months, were down by 9% on average, and were up only 20% of the time. Scary odds indeed.
Figure 2. Combined Market Timing Indicator (Latest = 1.11)
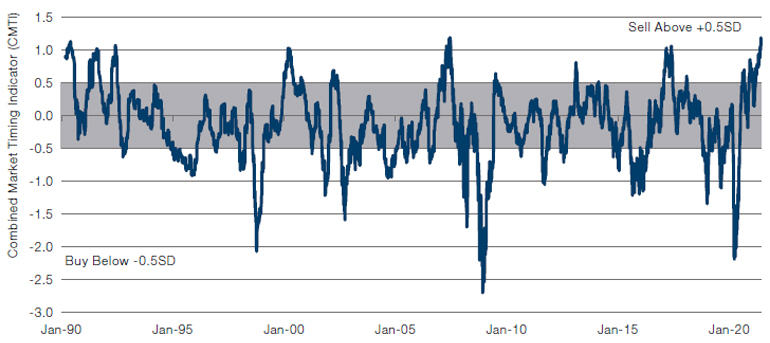
Source: MSCI, Morgan Stanley Research; as of June 2021.
Figure 3. Market Timing Indicators - Backtest
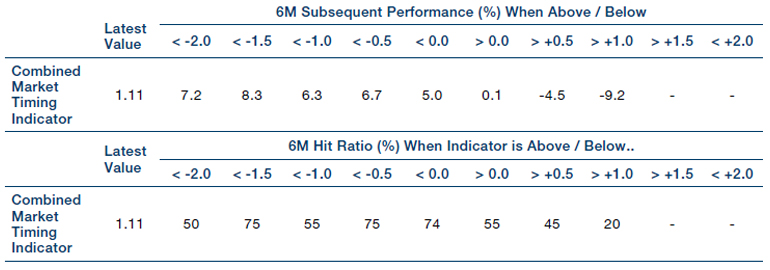
Source: Morgan Stanley; as of June 2021.
This cautious outlook chimes very well with our fundamental view on inflation, which is that it is much more persistent than investors now believe.
We believe history teaches us that policy dominates outcomes, and policy is now firmly pro-inflation, especially in the US.
Why would that be? We believe history teaches us that policy dominates outcomes, and policy is now firmly pro-inflation, especially in the US. We believe that inflation expectations stand a great chance of becoming unanchored within the new context of the Fed’s average inflation targeting; that supply bottlenecks are prevalent in various places in this K-shaped recovery; and that the fiscal policy tool is unlikely to be put back in the tool box now that it has proven so easy to use, and popular – this policy may well go global eventually.
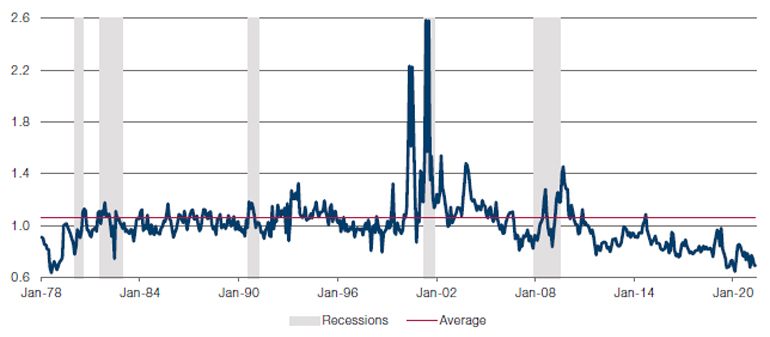
As a result, traditional assets could suffer, and nominal rates are more likely to go up than down, in our view. There is no escaping that US 10-year real rates at -75 basis points continue to be extremely low – and they should gravitate towards real GDP growth, at some point in the future. Figure 4 illustrates the upward pressure on nominal rates well.
We would not exclude a whiff of stagflation, either, as lead indicators could ease from their lofty levels. Furthermore, we have observed in the past that the stock-bond correlation flips positive – i.e., inflation becomes the dominant threat in the market – when core CPI is above 2.5%. Today, core CPI is already 4.5%, the highest since November 1991, and well above the 2.5% threshold.
Figure 4. Bond Yields’ Historical Relationship With ISM Is Consistent With Yields Being Much Higher
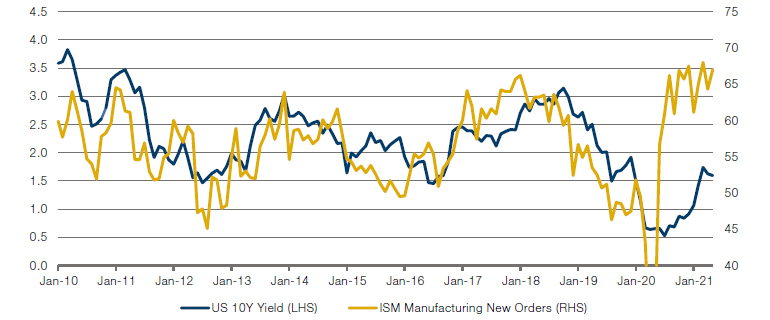
Source: Refinitiv, Credit Suisse Research; as of June 2021.
And it so happens that the correlation of various groups of stocks – e.g., Value, Growth, financials, tech – with bond market moves is higher than ever. Figures 5-6 illustrate a different point: stocks that tend to go down when rates rise are the most expensive ever, and stocks that tend to go up when rates rise are the cheapest ever. A very intriguing set-up! We know where we’d rather be.
Figure 5. US Large Caps Most Correlated With Treasury Bond Performance: Relative Forward PE
Source: National Bureau of Economic Research, Empirical Research Partner Analysis; as of June 2021.
Figure 6. US Large Caps Most Anti Correlated With Treasury Bond Performance: Relative Forward PE
Source: National Bureau of Economic Research, Empirical Research Partner Analysis; as of June 2021.
You are now exiting our website
Please be aware that you are now exiting the Man Institute | Man Group website. Links to our social media pages are provided only as a reference and courtesy to our users. Man Institute | Man Group has no control over such pages, does not recommend or endorse any opinions or non-Man Institute | Man Group related information or content of such sites and makes no warranties as to their content. Man Institute | Man Group assumes no liability for non Man Institute | Man Group related information contained in social media pages. Please note that the social media sites may have different terms of use, privacy and/or security policy from Man Institute | Man Group.