In this week’s edition: we question whether the honeymoon is over in Brazil; and why crude prices look vulnerable.
In this week’s edition: we question whether the honeymoon is over in Brazil; and why crude prices look vulnerable.
February 12 2019
Brazil: Is the Honeymoon Already Over?
Brazil has been one of the best-performing markets year-to-date on optimism over Jair Bolsonaro: The Ibovespa index has climbed about 9% this year through 6 February and is up about 36% since its 1-year low in June 2018.1 Indeed, brokers have begun pushing European stocks with Brazilian exposure, potentially just as the going gets a bit tougher.
The main reason behind our thinking is Brazil’s congress. Though they support him on his social policies, support for his fiscal reform (pensions and labour reform) is not guaranteed. Crucially, Bolsonaro’s pension reform plan – which includes extending the retirement age to 65, even that of the military, police and civil servants – looks far-reaching. This may require constitutional amendments, which need a two-thirds majority in both houses. That’s not a given.
Life for emerging markets populists is typically easier before they take office, in our view, and the honeymoon will not last for ever.
Figure 1: Bolsonaro’s Support in Congress
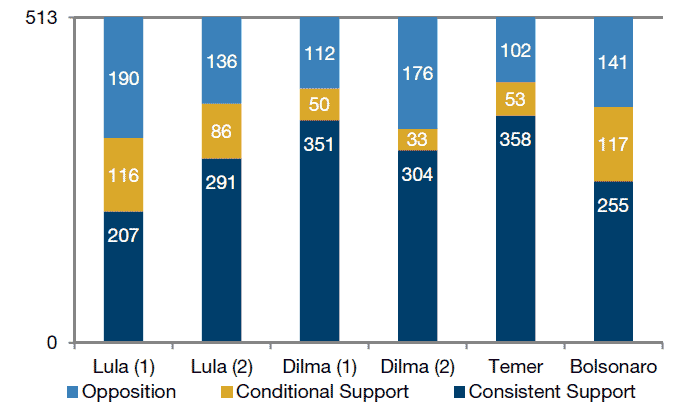
Source: RBC Capital Markets, Folha de Sau Paulo, DIAP, Financial Times; As of 4 February, 2019.
Figure 2: Voting History
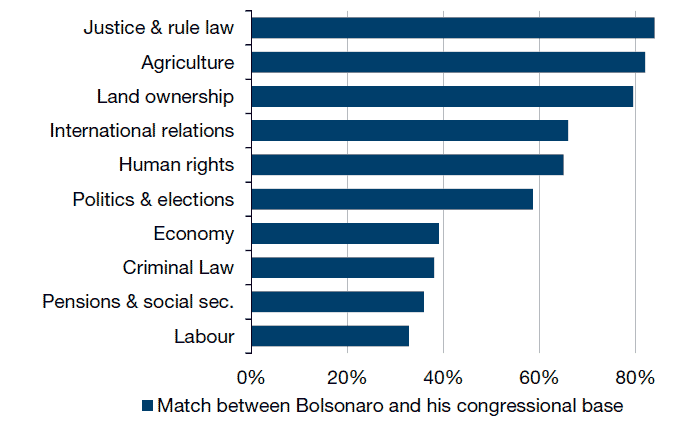
Source: RBC Capital Markets, Folha de Sau Paulo, DIAP, Financial Times; As of 4 February, 2019.
Crude Prices Look Vulnerable
World crude markets are running at a surplus of about 700,00 barrels a day as of 31 December 2018 (Figure 3). OPEC oil supply fell by about 890,000 barrels a day in January, which would theoretically remove the surplus.2
However, China has ramped up crude imports since the fourth quarter of 2018 (Figure 4). In our view, this could be stockpiling, trying to take advantage of weaker oil prices. If China reverts to its run rate of 37 million tons per month over the first three quarters of 2018 (versus 44 million at year-end), that’s a reduction in demand of 1 million barrels per day – essentially wiping out the OPEC cuts.
Absent a recovery in end-demand, crude prices look vulnerable, in our view.
Figure 3: Excess Crude Oil Supply?
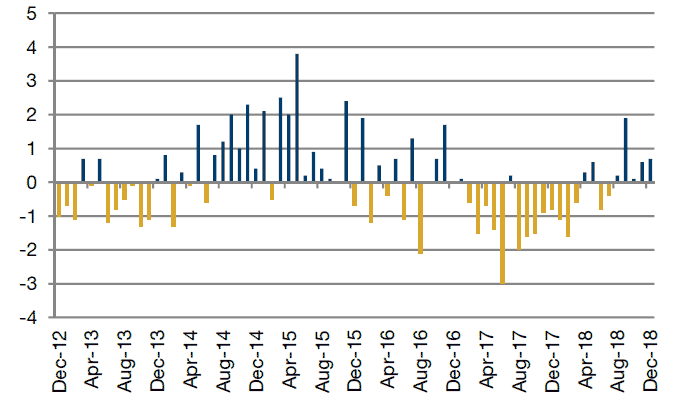
As of 31 December 2018.
Figure 4: Chinese Oil Imports
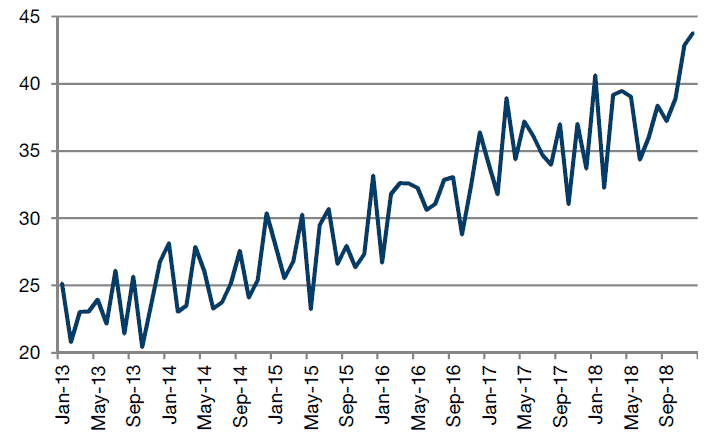
As of 31 December 2018.
US Recession? Keep it Real
As at the end of 2018, the real Fed Funds rate (the Fed Funds rate minus core CPI) moved positive for the first time since June 2008. This is an important metric as it gives some sense of the extent to which companies are able to cover their cost of debt through price rises. Arguably, the real Fed Funds has been negative for an unprecedented amount of time over the last decade (Figure 5), being a driver of record leverage in corporate America. Now that it has finally gone positive, could this be a catalyst to recession?
We think yes, but not yet. The real Fed Funds stood at 7 basis points at the end of 2018. It has never been lower than 72bp at the start of a recession across the last eight cycles, and averages 313bp.3 Now there is of course the argument that with all estimations of the natural rate coming down, the threshold for turbulence could be lower than in the past. Indeed, we have a lot of sympathy with this view. However, we still think there is a margin of safety and with the Federal Reserve pausing on rate hikes for the time being, we would be surprised if the cycle ended in the short term.
Figure 5: The Real Fed Funds Rate
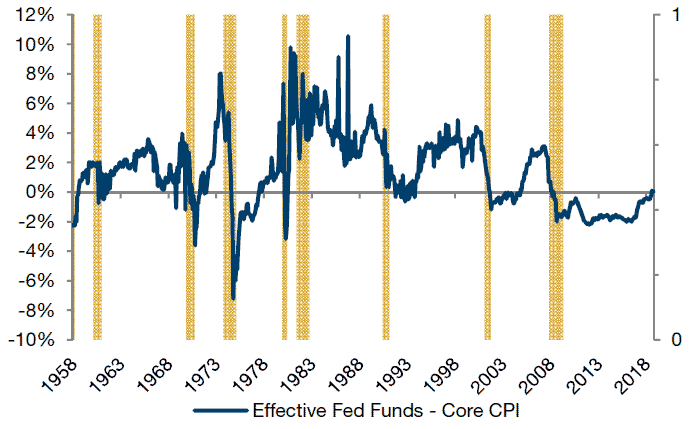
Source: Man Solutions, Bloomberg; As of 31 December 2018.
With contribution from: Edward Cole (Man GLG, Managing Director) and Henry Neville (Man Solutions, Analyst).
1. Bloomberg.
2. https://uk.reuters.com/article/oil-opec-survey/opec-oil-output-drops-in-january-on-saudi-cut-outages-and-sanctions-idUKL5N1ZV3IZ
3. Calculations based on data from Bloomberg.
You are now exiting our website
Please be aware that you are now exiting the Man Institute | Man Group website. Links to our social media pages are provided only as a reference and courtesy to our users. Man Institute | Man Group has no control over such pages, does not recommend or endorse any opinions or non-Man Institute | Man Group related information or content of such sites and makes no warranties as to their content. Man Institute | Man Group assumes no liability for non Man Institute | Man Group related information contained in social media pages. Please note that the social media sites may have different terms of use, privacy and/or security policy from Man Institute | Man Group.