Do criticisms of buybacks – manipulate stock prices higher, crowd out investment, de-equitise public capital markets – have merit?
Do criticisms of buybacks – manipulate stock prices higher, crowd out investment, de-equitise public capital markets – have merit?
April 2019
Executive Summary
The nominal value of announced share buybacks is running at USD9.8 trillion cumulatively globally over the last 20 years. Of this, the vast majority is attributable to US-domiciled companies, at over USD7 trillion. Almost 70% of buyback activity has come in the last 10 years, and almost 50% in the last five years.
For the last five years, the drumroll of criticism toward buybacks has grown steadily louder, broadly coinciding with changing political mood music in developed economies: away from neo-liberal centrism toward populism on both sides of the political spectrum, but most recently, espoused by Democratic Senators Elizabeth Warren, Chuck Schumer and Bernie Sanders. With Sanders and Warren intending to run for the Democratic nomination for the 2021 presidential election, the issue stands a good chance of staying in the mainstream.
We take a look at four criticisms of share buybacks: 1. Share buybacks crowd out investment and employment; 2. Share buybacks manipulate stock prices higher; 3. Share buybacks are de-equitising public capital markets; and 4. Firms are borrowing unsustainably to buy back stock.
Based on our examination of the data, we believe much of the criticism of buybacks is unfounded. However, there are legitimate questions over market impact and structural implications. In summary, our conclusions are quite mixed:
- There is no evidence of serial underinvestment in fixed capital;
- R&D spending growth at listed companies is significantly slower than at private companies;
- Return on capital is higher in the US than Europe, against a backdrop of consistently higher capex in Europe;
- Buybacks have an impact on price: execution could cost approximately 3% annually, and there may be an announcement premium on top of that worth 2%;
- US public equity markets are shrinking, and;
- The allegation that buybacks are destroying balance sheets is unfounded.
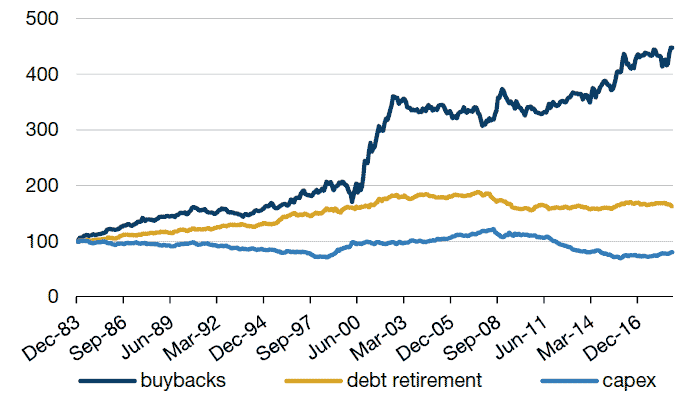
What is clear to us is that financial markets reward allocations of capital in favour of buybacks versus either debt retirement or capex. In fact, research from Man Numeric shows that systematically betting on companies that invest the most in fixed capital versus those refraining from capex lost money more consistently, while the approach of improving balance sheets added negligible value over the periods looked at.
Introduction
Buybacks are inextricably linked to the political economy of neo-liberalism: they were ushered in under Ronald Reagan, and the criticism about their utility grows louder the more that populism takes hold.
Reaganomics embodied the philosophy of the Chicago School, with Milton Friedman – its most notable proponent – serving on Reagan’s Economic Policy Advisory Board for the duration of the administration. Famously, Friedman argued that the sole social responsibility of a business is to maximise value for shareholders1 and Reagan’s supply-side reform and deregulation was geared towards unshackling business. For Chicago School economists, salaried managers created an agency problem in the management of businesses, in not bearing the risks of wasteful capital allocation:
“Separation and specialisation of decision management and residual risk bearing leads to agency problems between decision agents [management] and residual claimants [shareholders].” 2
The solution to this agency problem was to align management with shareholders, a task that corporate America took to with alacrity: in 1980, average stock option grants for CEOs were approximately 24% of salary and bonus; by 1992, that had risen to just over 90%. Moreover, the proportion of CEOs being compensated with stock options had risen from under 60% to more than 80%.3
In 1982, the SEC drafted Rule 10b-18, introducing a safe-harbour ceiling that limited buybacks to 25% of the trailing four weeks’ average daily volume. This relieved management teams from the risk of prosecution for stock manipulation. This, in combination with the growing trend toward stock-based compensation, opened the flood gates to widespread open-market purchases of stocks. In the 10 years to 1984 (when Rule 10b-18 was adopted), buybacks averaged 4.4% of earnings before extraordinary items; in the 10 years after, this rose to 23.4% and has continued higher since.4
For the last five years, the drumroll of criticism toward buybacks has grown steadily louder, broadly coinciding with changing political mood music in developed economies: away from neo-liberal centrism toward populism on both sides of the political spectrum, but most recently, espoused by Democratic Senators Elizabeth Warren, Chuck Schumer and Bernie Sanders. With Sanders and Warren intending to run for the Democratic nomination for the 2021 presidential election, the issue stands a good chance of staying in the mainstream. Indeed, with Warren explicitly proposing legislation to repeal Rule 10b-18, we believe there is a non-negligible risk that the era of booming buybacks could come to a close.
Below, we outline the trends in corporate buybacks over time and discuss the criticism (political and financial) levelled at the practice of repurchasing securities. While offering no view on the merits or likelihood of regulation to curb the practise of buying back stock, we consider the ramifications for equity markets in the event that regulation is introduced. The data and analysis focuses predominantly on the US – where buybacks are highest in nominal terms and as a proportion of total cash allocated – and where the debate over regulation is at its loudest.
Share Buybacks in Historical Context – What Is All the Fuss About?
The nominal value of announced share buybacks is large, running at USD9.8 trillion cumulatively globally over the last 20 years (Figure 1). Of this, the vast majority is attributable to US domiciled companies, at over USD7 trillion. Almost 70% of buyback activity has come in the last 10 years, and almost 50% in the last five years.
So, we can say that in nominal terms, activity is accelerating.
Figure 1. Nominal Stock Repurchases
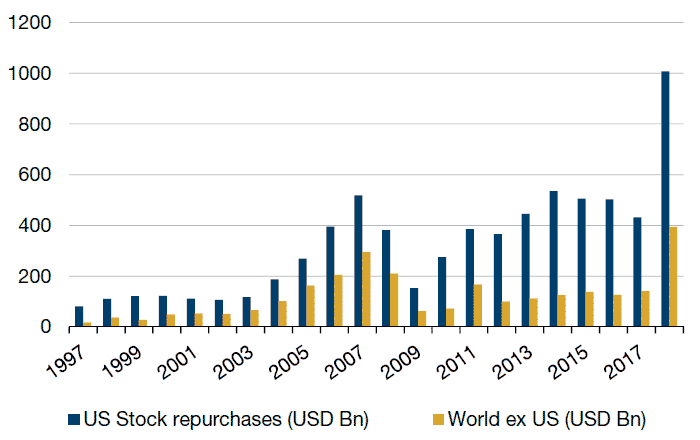
Source: Factset, Bloomberg, Bernstein Research, Man Group. Data to 2017 are reported accounting data. 2018 are buyback announcements from Bloomberg’s corporate actions database.
The key here is nominal terms. 2018 was the year when Apple became the second company to achieve a market cap of more than USD1 trillion (after Petrochina’s H-share spike to over USD1 trillion for one day in June 2007), so market caps have gotten larger. When adjusted for market cap, the scale of buybacks is less impressive (Figure 2). Indeed, even with the sugar rush of the US corporate tax cuts and about USD600 billion in repatriated profits, 2018 just eclipsed the previous peak of 2007.
Figure 2. Stock Repurchases as % of Market Cap
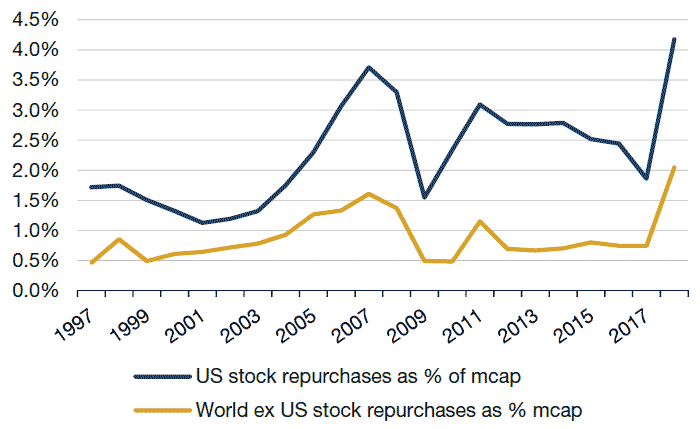
Source: Factset, Bloomberg, Bernstein Research, Man Group. Data to 2017 are reported accounting data. 2018 are buyback announcements from Bloomberg’s corporate actions database. Market cap data are annual averages.
When cash returns are looked at in aggregate (buyback yield plus dividend yield), yields are actually remarkably stable over time: the 20-year average for this measure is 4.4%, against the most recent level of 4.75%. In other words, it is not obvious that corporate America has gone on some sort of unprecedented cash return splurge. Indeed, while there has been some increase in buybacks as a proportion of total cash returns, it is a relatively modest trend – from 50/50 20 years ago to 60/40 in favour of buybacks today – and completely consistent with a declining maximum tax rate on long-term capital gains that renders buybacks a more fiscally efficient form of cash returns than income tax.5
Figure 3. S&P500 Dividend and Buyback Yields
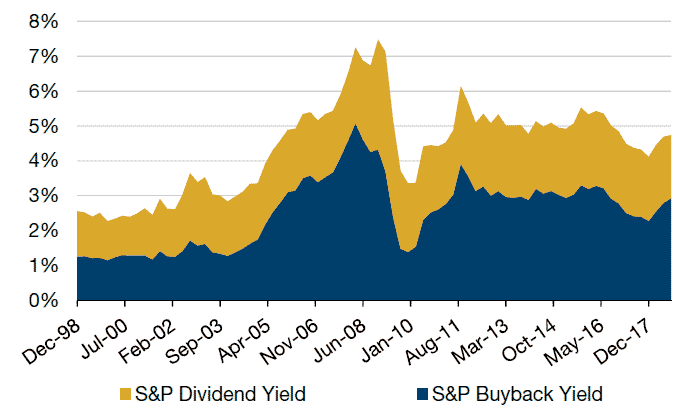
Source: S&P, Citigroup Global Markets, Man Group; as of September 2018. Buyback data are based on reported accounting data, in gross terms.
Only when we look at total cash returns as a proportion of cash deployed do we start to see the root cause of the current political animus. Figures 4-7 show total cash deployed by region split into capital expenditures, dividends and buybacks. Since 2005, buybacks and dividends have consumed about half of total cash deployed, and the 2016 level of almost 57% exceeded the pre-global financial crisis (‘GFC’) highs. We would suggest that it is this tendency for more than half of cash to go back to shareholders, unique among global regions, combined with the large numbers (whose ears don’t prick up at the mention of USD1 trillion of buybacks in a calendar year in one country?), as populism rears its head that has created the conditions for a backlash.
Figures 4-7. Regional Use of Cash
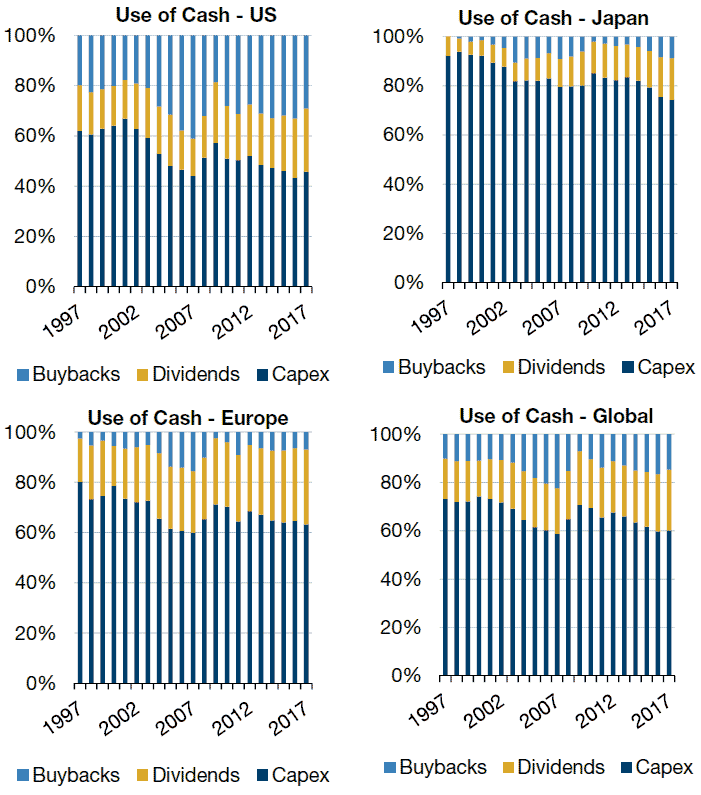
Source: Factset, MSCI, Bernstein Research, Man Group; as of 2017. Having laid out the data, below we will methodically reflect our impression of the political and financial criticism.
The Criticism
Criticism 1: Share Buybacks Crowd Out Investment and Employment
This is principally a politically motivated criticism in response to the chart on cash utilisation (above), espoused notably by Democrat Senator Elizabeth Warren, who has said that “buybacks create a sugar high for the corporations … boosting prices in the short run, but the real way to boost the value of a corporation is to invest in the future, and they are not doing that.”6 Among academic circles, the argument has been promulgated by William Lazonick, a professor of economics at the University of Massachusetts Lowell, whose research interests focus on industrial competitiveness:
“Stock buybacks are an important part of the explanation for both the concentration of income among the richest households and the disappearance of middle-class employment opportunities in the United States over the past three decades. Over that period, the resource allocation regime at many, if not most, major US businesses corporations have transitioned from ‘retain-and-reinvest’ to ‘downsize-and-distribute’.” 7
Lazonick’s arguments are deeply rooted in opposition to the neoclassical theory of the firm’s role as a maximiser of shareholder value. Our aim is not to wade into this debate on political economy, but rather to examine the data, namely:
- Is there evidence of serial underinvestment in the US?;
- Are returns on capital stagnating?; and
- Does defining spending through the traditional lens of the cash flow statement (i.e. capex) miss an important shift in how companies invest?
1. Is There Evidence of Serial Underinvestment in the US?
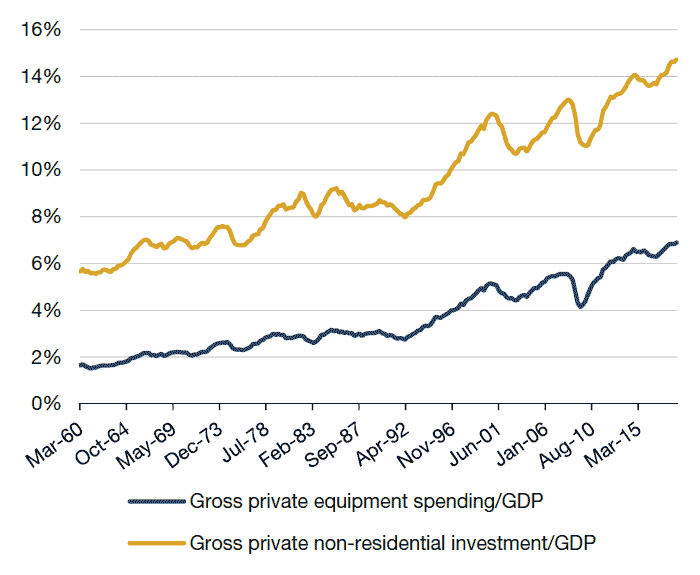
Starting with national accounts data, there is limited evidence that the private sector is underinvesting, in our view. Figure 8 shows private domestic investment and spending on equipment as a percentage of GDP, from the expenditure classification of data. Both series ended 2018 at record-high levels.
Figure 8. US Private Investment and Equipment Spending
Source: Bureau of Economic Analysis, Bloomberg, Man Group; as of December 2018.
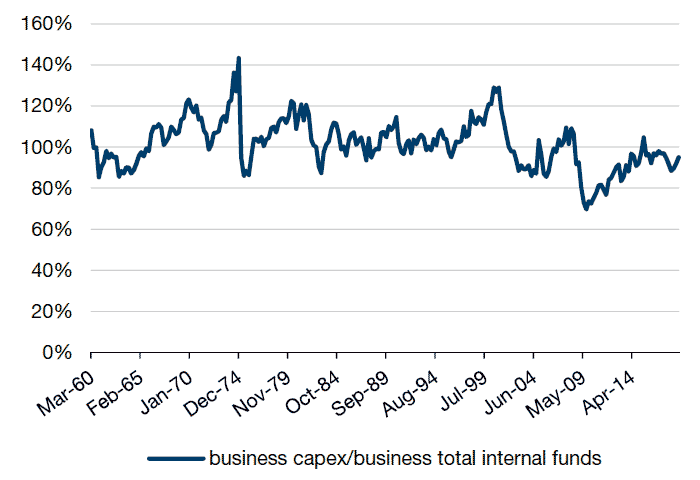
When scaled relative to the corporate sector, the picture does change somewhat because the corporate sector has grown as a percentage of GDP. However, it still fails to show a precipitous decline in investment. Figure 9 is from the Federal Reserve’s flow of funds data, showing total capex of businesses to total internal funds (effectively operating cash flow). At 95% by the end of 2018, this measure is not even one standard deviation below a nearly 60-year average.
Figure 9. US Business Capex/Total Internal Funds
Source: Federal Reserve, Bloomberg, Man Group; as of December 2018.
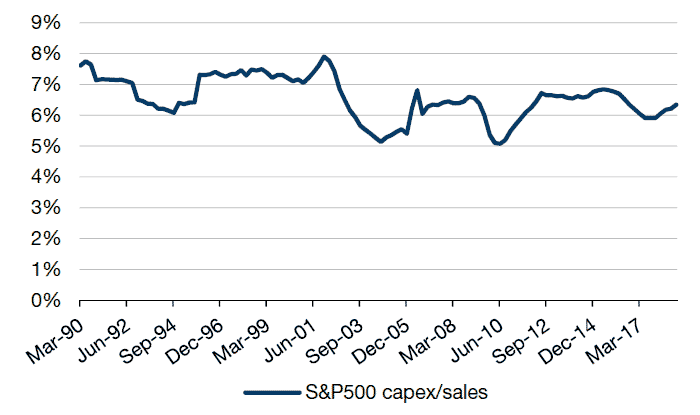
In the realm of public markets, the data also argue against this criticism. Figure 10 shows the typical representation of recurring capital intensity, capex to sales. The latest data point as of December 2018 is 6.3%, only marginally below the average of 6.6% from 1990 (longest time horizon of available data).
Figure 10. S&P 500 Index Capex/Sales
Source: Bloomberg, Man Group; as of December 2018.
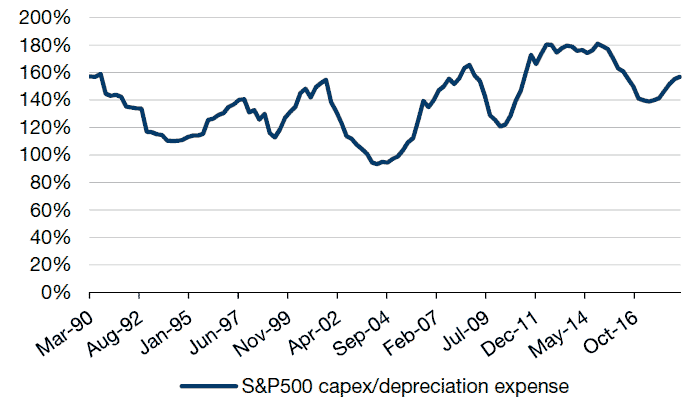
If we look at capex versus depreciation to gauge corporate America willingness to reinvest in capital stock, the picture is quite encouraging (Figure 11): for every dollar of depreciation expense, S&P500 companies are investing USD1.57 in new capital, versus the average since 1990 of USD1.39. This is definitively not a picture of sweating existing capital to maximise net present value.
Figure 11. S&P500 Capex/Depreciation Expense
Source: Bloomberg, Man Group; as of December 2018.
2. Are Returns on Capital Stagnating?
It is worth reflecting on what structurally higher levels of capex mean for return on capital. Figures 4-7, showing total use of cash, demonstrate that the sum of buybacks and dividends in the US is almost 20 percentage points higher in Europe than the US. Both the S&P 500 and Stoxx 600 indices derive approximately 50% of revenues from international exposure, so there is at least some basis for comparing return on capital on a sector neutralised basis.8
Although we grant that these data do not demonstrate a causal relationship, Figure 12 shows that since the GFC, US companies have made substantially higher returns on capital than their European counterparts. And, at an average of 7.5% return on capital for European companies since the end of 2008, amid slowing growth and low inflation, it is arguable that the incremental return on new capex has not been the best use of capital. Over time, if the fears of secular stagnation in mature economies turn out to be correct, we would expect buybacks to be potentially return on capital invested (‘ROIC’)- enhancing, or at least helping to preserve more optimal levels of returns, in that they can help prevent wasteful overinvestment in dilutive projects.
Figure 12. Sector-Neutral S&P 500 and Stoxx 600 Return on Capital
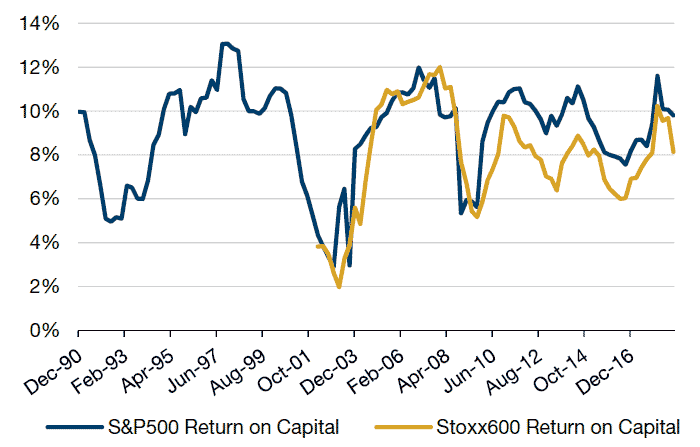
Source: Bloomberg, Man Group. Note: S&P500 GICS sector simple average, & Stoxx600 ICB industry average; as of December 2018.
It is also notable that there has historically been a strong positive correlation between sector ROIC in the US and buyback volumes. Though this is exaggerated somewhat by tech, removing it from the sample still leaves a positive slope, and an r-squared of 54%. If we look at 3-year prior buybacks to market cap versus 2018 ROIC, the picture is unchanged, with an R-squared of 76% (Figure 13). In essence, that higher profitability and management team focus on optimal capitalisation are associated with higher cash returns is not altogether surprising. In conjunction with the regional data above, the suggestion that a focus on buybacks is diminishing returns does not look founded, according to our analysis.
One note of caution is that it remains to be seen (and is a subject worthy of discussion all on its own) whether industry structure and consolidation that has led to notable profitability in some sectors will undermine growth and profitability in the long-run.
Figure 13. US Sector ROIC and Buybacks as % of Market Cap
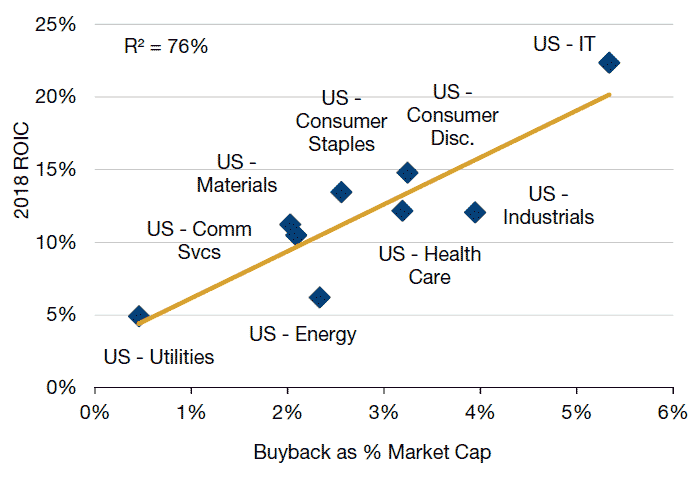
Source: Citigroup Global Markets.
3. Does Defining Spending Through the Traditional Lens of the Cashflow Statement (i.e. Capex) Miss an Important Shift in How Companies Invest?
Capital-light businesses consume investment in different ways to capital-heavy businesses. It is arguable that for knowledge-based sectors, research and development (‘R&D’) expenses should routinely be capitalised on the balance sheet rather than run through the income statement.9 IFRS accounting rules allow R&D expenses to be capitalised and carried as an intangible asset if the company can demonstrate that the result is a commercially viable product and the cost of the asset can be reliably measured. In contrast, US GAAP requires R&D costs to be expensed in the income statement as incurred. From Federal Reserve and national accounts data, we can arrive at a proxy of capitalised R&D: by adjusting the Fed’s aggregate for operating cash flow (adding R&D expense back in) and scaling against expenditure on intellectual property from the GDP data, we get a sense of how non-capital spending in the US has grown in recent decades. Again, this shows that there doesn’t seem to be any substance to the claim that US corporates are not investing, in our view.
Figure 14. Intellectual Property Spending/Adjusted Total Business Internal Funds*
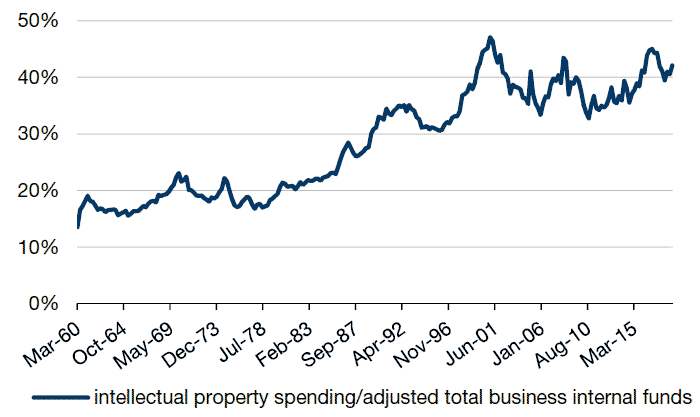
Source: Federal Reserve, Bloomberg, Bureau of Economic Analysis, Man Group; As of December 2018. *Adjusted total business internal funds is the sum of intellectual property spending and total business internal funds.
When looking at R&D/sales for listed equities, we get the first glimpse of justification for the criticism, as there is a meaningful difference in the economy-wide trends from those in the stock market. S&P500 R&D intensity has fully recovered its slump post-GFC, but has not increased materially over time, which we find somewhat surprising given the growth of the knowledge economy and the intangibles associated with it. Indeed, where S&P500 R&D expense has grown 3.7% compound since 1990, economy-wide corporate expenditure on intellectual property has grown 6.4%. While we cannot categorically conclude that buybacks are a disincentive to invest in R&D, we can state that public companies, where management compensation is invariably tied to share price, have grown spending – that impacts earnings and margins – less than their private counterparts.
Figure 15. S&P500 R&D/Sales
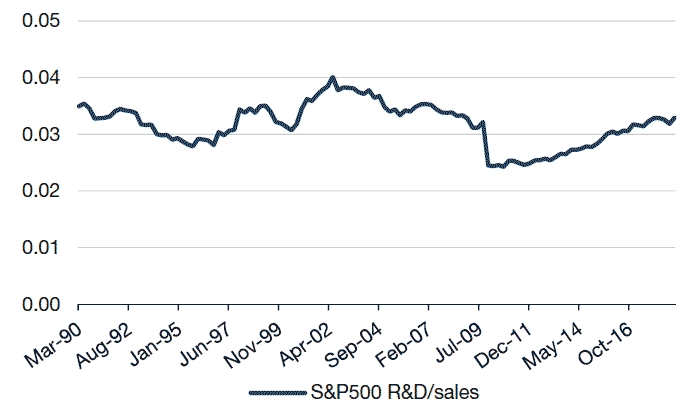
Source: Bloomberg, Man Group; as of December 2018.
Criticism 2: Share Buybacks Manipulate Stock Prices Higher
This allegation is not purely political in origin. In his 1999 letter to shareholders, in rebuffing calls to buy back stock in Berkshire Hathaway, Warren Buffett said:
“Now, repurchases are all the rage, but are all too often made for an unstated and, in our view, ignoble reason: to pump or support the stock price.”10
Before we address the specifics of announcement effects or cost of execution, it is worth looking at the fundamental potential alpha opportunity offered by buybacks.
Analysis from Man Numeric suggests that there is a historical fundamental buyback effect on stock prices. Figure 16 shows the cumulative long/short returns from a dedicated buyback sample (long top quintile repurchasers over a trailing 12-month period, short bottom quintile repurchasers11). Compound annual returns are approximately 4.5%, and are persistent. Even after stripping out the notable gains during the deflation of the dotcom bubble, the annualised return is still 2.7%.
Figure 16. Cumulative Returns From L/S Best Versus Worst Buybacks
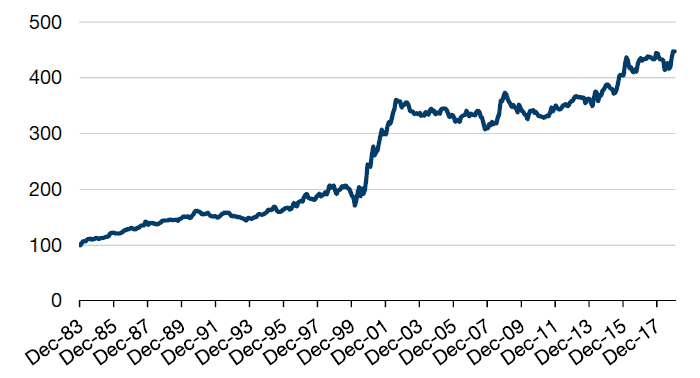
Source: Man Numeric; As of December 2018. Note: Returns are gross and do not include cost of trading. Top quintile versus bottom quintile, re-set monthly.
Man Numeric uses this signal as part of their quality factor, and it is reasonably intuitive that companies that tend toward higher cash returns, those that focus on good corporate governance and alignment with shareholders, those that avoid dilution from stock-based compensation and focus on consistency of returns on capital to manage consistent payouts, can outperform. We believe this is markets working well, and not a symptom of manipulation.
However, we also need to consider the potential for less fundamental impacts: namely, the announcement catalyst (speculators reacting to headlines) and market impact (the price impact associated with the friction of executing a buyback). It is these two latter points that are more squarely the root of the criticism that buybacks manipulate prices higher.
1. The Impact of Buyback Announcements on Price
Utpal Bhattacharya and Stacey Jacobsen have conducted a highly detailed study into the impact that buyback announcements have on price.12 Their sample looked at more than 7,600 firms from 1985 to 2012 that announced open market buybacks. Those that repurchased stocks within the fiscal year were classified as repurchasers (76% of the sample), and those that did not (24%, the balance) were non-repurchasers. Using testing periods from one day prior to the announcement to between one and five days after the announcement, the median abnormal price impact was found to be approximately 2%, with minimal differences for repurchasers versus non-repurchasers.
In our view, this is a material impact, particularly in a world of potentially lower equity returns in the future. We note with some interest that Cliff Asness et al argue otherwise, in part, reasonably, because not the entire cohort of companies buys backs stock, but less comfortably because historic equity returns have been so high:
“If every constituent repurchased shares in a given year at historically high normal sizes, this would account for between 1% and 2% index price level appreciation … The recent bull market, whether measured from March 2009 or January 2013, has been accompanied by annualized returns on the Russell 3000 of more than 15%. The 1% to 2% annual increase from share purchases is a small percentage of the total run-up of the index.”13
We will examine why this might matter later, in considering what the implications of a change in buyback regulation might mean.
2. The Friction Associated with Executing Buybacks
Given the USD6-7 trillion in notional volume Man Group affiliates trade each year across its various strategies, understanding the cost and impact of transactions is extremely important. Man Group execution research has estimated the impact of executing orders based on participation size. This is shown in Figure 17 for US equities. It is worth remembering at this point that the SECs Rule 10B-18 allows up to 25% of trailing 4-week average daily volume for open market buybacks.
Figure 17. Cost of Trading at Various Participation Rates, US Equities
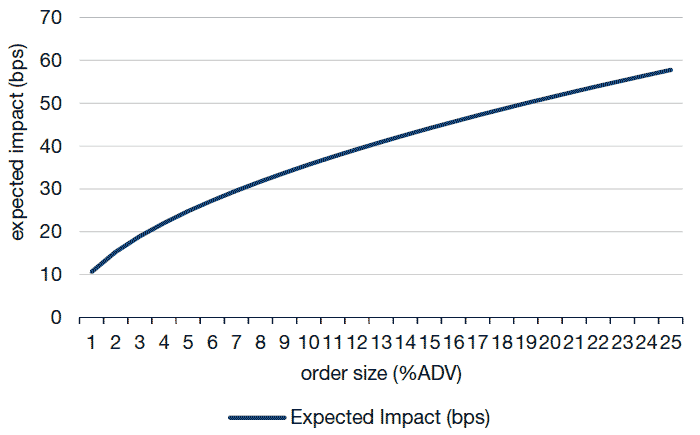
Source: Man Group Execution Research; Market analysed is the S&P 500 Index, between April 2018 and March 2019.
Using this estimate, assuming that 90% of announced buybacks are executed, that they are done in a linear fashion equally over 12-months, and comparing to daily liquidity of the Russell 1000 (to account for the fact that the majority of buyback programmes are in larger cap companies), we can arrive at some sort of estimate for market impact in aggregate.
Figure 18. Estimated Impact Based on Russell 1000 Value Traded
| Monthly Buyback Executed (USD bn) | Russell 1000 Monthly Value Traded (USD bn) | Buybacks as % of Value Traded | Estimated Impact (bp) | Cumulative Impact (bp) | |
|---|---|---|---|---|---|
| Jan 18 | 41.5 | 1117.5 | 3.7% | 22.0 | 22.0 |
| Feb 18 | 43.8 | 1201.8 | 3.6% | 22.0 | 44.1 |
| Mar 18 | 49.6 | 1291.3 | 3.8% | 22.0 | 66.0 |
| Apr 18 | 49.1 | 1111.7 | 4.4% | 22.0 | 88.2 |
| May 18 | 50.7 | 1095.0 | 4.6% | 24.8 | 113.0 |
| Jun 18 | 58.8 | 1264.4 | 4.6% | 24.8 | 137.7 |
| Jul 18 | 67.4 | 1031.5 | 6.5% | 29.6 | 167.3 |
| Aug 18 | 72.6 | 1047.3 | 6.9% | 29.6 | 196.9 |
| Sep 18 | 73.0 | 1122.9 | 6.5% | 27.3 | 224.2 |
| Oct 18 | 73.9 | 1454.8 | 5.1% | 24.8 | 249.0 |
| Nov 18 | 74.5 | 1234.8 | 6.0% | 27.3 | 276.2 |
| Dec 18 | 76.1 | 1285.4 | 5.9% | 27.3 | 303.5 |
| Jan 19 | 75.5 | 1161.7 | 6.5% | 29.6 | 333.1 |
| Feb 19 | 74.6 | 965.1 | 7.7% | 31.7 | 364.8 |
Source: Man Group, Bloomberg; as of February 2019.
On this basis, for the 14 months from January 2018 to February 2019, buybacks have averaged 5.4% of Russell 1000 value traded14, with an estimated monthly average cost of 26 basis points, and annualised cost of approximately 300 bp. There is, of course, scope for the assumptions used to be wrong, chiefly that buybacks are executed over longer time periods. We can have some conviction in this methodology, in that the ratio of announced buybacks to reported buybacks in the subsequent calendar year has averaged 104% since 2003. Even if we are 50% wrong, there are grounds to consider at least 150 bp annual impact, even before considering the announcement effect discussed above.
Criticism 3: Share Buybacks Are De-Equitising Public Capital Markets
Man Solutions’s Ben Funnell and Henry Neville, in their work on a savings glut meeting an asset drought (The Levitation Thesis, November 2017) noted that “savings pools may be starting to push the seams of their investable universes.”
De-equitisation is one part of this equation, whereby stocks retired by buyback or acquisition exceed new stocks issued in capital raising. The Federal Reserve’s Equity Issuance and Retirement database shows a cumulative USD6.2 trillion of equity has been retired since 1995 on the broad definition that includes mergers. Looking at net issuance (new capital minus buybacks), the pattern in the US is one that tends to support Funnell’s and Neville’s levitation thesis, but that in the long run (and absent periodic shocks that require rapid recapitalisation of equities) poses questions for allocators to US public equities: greater allocation to international markets or private markets seems more likely, in our view.
Figure 19. Net Equity Issuance as % of Market Cap
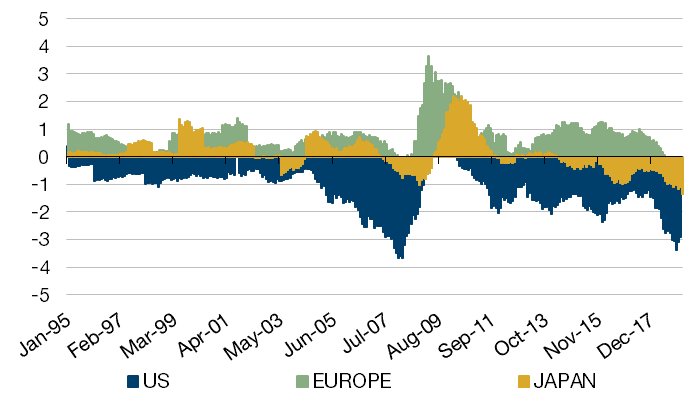
Source: Bloomberg, Datastream, Bernstein research; as of February 2019.
Asness et al argue that we do not have to fear that buybacks are self-liquidating because they have not been funded with internally generated cash. Were this the case, we would expect to see a change in quoted companies’ capital structures, with a growing proportion of debt versus shareholders’ equity. Yes, nominal levels of debt held by listed companies have gone up, but – relative to equity levels – are over 50 percentage points below the long-term average, and there has been minimal pick-up since the post-GFC nadir. The picture is essentially identical for broader measures of US equities, too.
Figure 20. S&P 500 Total Debt/Shareholders’ Equity
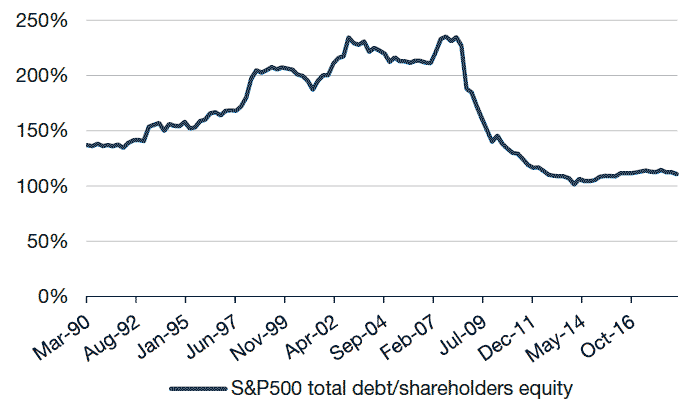
Source: Bloomberg; as of December 2018.
Criticism 4: Firms Are Borrowing Unsustainably to Buy Back Stock
Given the data we have presented above, we have little to say on this argument other than, in aggregate, it appears factually wrong, according to our analysis. There are undoubtedly examples of companies leveraging up to buy back stock. Apple is one such company, which has bought back USD193 billion from 2013 to end-2018, and whose total debt has increased from zero to USD114.5 billion over the same period. But it is not symptomatic of corporate America, in our view.
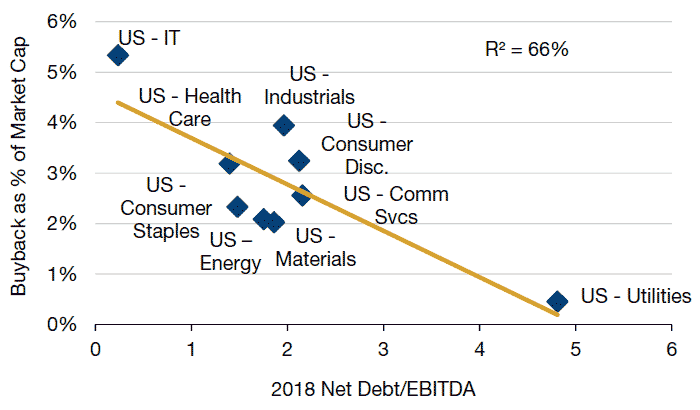
The flipside of the relationship between ROIC and buyback intensity is that sectorally, leverage and buybacks are inversely correlated.
Figure 21. US Sector Buybacks as % of Market Cap and Net Debt/EBITDA
Source: Citigroup Global Markets.
Conclusion
Based on our examination of the data, we believe much of the criticism of buybacks is unfounded. However, there are legitimate questions over market impact and structural implications. In summary, our conclusions are quite mixed:
- There is no evidence of serial underinvestment in fixed capital;
- R&D spending growth at listed companies is significantly slower than at private companies;
- Return on capital is higher in the US than Europe, against a backdrop of consistently higher capex in Europe;
- Buybacks have an impact on price: execution could cost approximately 3% annually, and there may be an announcement premium on top of that worth 2%;
- US public equity markets have been shrinking, and;
- The allegation that buybacks are destroying balance sheets is unfounded.
What is clear is that financial markets have rewarded allocations of capital in favour of buybacks versus either debt retirement or capex. In fact, research from Man Numeric shows that systematically allocating to companies that invest the most in fixed capital versus those refraining from capex loses money quite consistently, while the approach of improving balance sheets adds negligible value.
Figure 22. Cumulative Returns from L/S Buybacks, Debt Retirement and Capex
Source: Man Numeric; as of December 2018. Note: returns are gross and do not include cost of trading, top quintile versus bottom quintile, re-set monthly.
In this context, corporate managers are only responding to incentives, which stem from the widespread adoption of stock-based compensation: the cherry on top of management compensation is derived from share price, not operational metrics. This might explain why R&D expenditure growth (an income statement item that directly affects margins) has grown more slowly for listed companies than for their private counterparts.
Finally, we offer some thoughts on how a buyback-less future could look. If the sun is setting on neoliberalism, this bears some consideration, because the veracity of the arguments against buying back stock, which are at worst balanced in our view, may have nothing to do with the scope and direction of regulation.
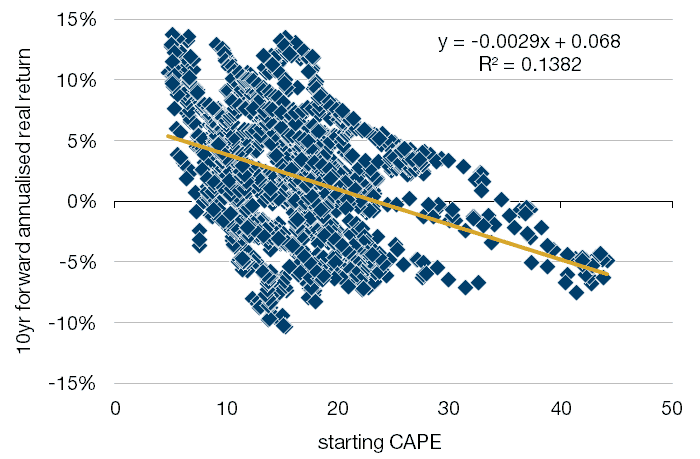
The relationship between starting price-to-earnings (‘PE’) ratios and 10-year forward real returns from Robert Shiller’s long-run CAPE data suggests an unpromising decade for US equities. From 1881 to the first quarter of 2009, there have been 57 months where the CAPE has exceeded 30. Subsequent real 10-year forward price return has been negative 84% of the time, with a mean 10-year real annualised return of -2.8%, and a median of -3%.
Figure 23. Shiller CAPE and 10-Year Forward Annualised Returns, 1881-2009
Source: Robert Shiller, Man Group.
Since June 2017, the CAPE has been above 30 for 17 of 22 months. To recap, our estimated cost of executing buybacks worth 5.4% of Russell 1000 average daily value is approximately 3%, excluding the potential beneficial effects of announcements on price. If open market buybacks continue at their current pace, there could be some capacity to offset the potential negative forward returns. In the event that buybacks are banned, however, this would be less likely, and with less de-equitisation, the effect of gravity could be greater still.
Bibliography
Asness, Clifford, Hazelkorn, Todd and Richardson, Scott, The Journal of Portfolio Management, Vol. 44 No. 5, Spring 2018, Buyback Derangement Syndrome
Bhattacharya, Utpal & Jacobsen, Stacey E., Review of Finance, May 2015, The Share Repurchase Announcement Puzzle: Theory and Evidence
Buffett, Warren, Chairman’s Letter, Berkshire Hathaway, 1999
Damodaran, Aswath, Stern School of Business NYU, December 28 1998, Research & Development Expenses: Implications for Profitability Measurement and Valuation
Edmans, Alex, Harvard Business Review, September 2017, The Case for Stock Buybacks
Fama , Eugene F. & Jensen, Michael C., Journal of Law & Economics, Vol. 26, No. 2, June 1983, Corporations and Private Property
Fenn, George W., & Liang, Nellie, Journal of Financial Economics, Vol. 60, March 2000, Corporate Payout Policy & Managerial Stock Incentives
Friedman, Milton, The New York Times, September 13 1970, The Social Responsibility of Business is to Increase Profits
Grullon, Gustavo & Michaely, Roni, Journal of Finance, Vol. 57, No. 4, August 2002, Dividends, Share Repurchases, and the Substitution Hypothesis
Hall, Brian J. & Liebman, Jeffrey B., The National Bureau of Economic Research, Working Paper No. 6213, October 1997, Are CEOs Really Paid Like Bureaucrats?
Kranish, Michael, The Boston Globe, June 4 2015, Warren decries stock buybacks, high CEO pay
Lazonick, William, Center for Effective Public Management at Brookings, April 2015, Stock buybacks: From retain-and-reinvest to downsize-and-distribute
Maas, Steve, National Bureau of Economic Research, February 2017, Explaining Low Investment Spending
1. Milton Friedman, The New York Times, September 13 1970, The Social Responsibility of Business is to Increase Profits.
2. Eugene F. Fama & Michael C. Jensen, Journal of Law & Economics, Vol. 26, No. 2, June 1983, Corporations and Private Property, p. 312.
3. Brian J. Hall & Jeffrey B. Liebman, The National Bureau of Economic Research, Working Paper No. 6213, October 1997, Are CEOs Really Paid Like Bureaucrats?, Table IIa and Figure 1.
4. Gustavo Grullon & Roni Michaely, Journal of Finance, Vol. 57, No. 4, August 2002, Dividends, Share Repurchases, and the Substitution Hypothesis, p. 1655.
5. Tax Policy Center, Historical Capital Gains and Taxes database, Ubran Institute and Brookings Institution https://www.taxpolicycenter.org/statistics/historical-capital-gains-and-taxes
6. Michael Kranish, The Boston Globe, June 4 2015, Warren decries stock buybacks, high CEO pay.
7. William Lazonick, Center for Effective Public Management at Brookings, April 2015, Stock buybacks: From retain-and-reinvest to downsize-and-distribute, p. 2.
8. Note, without this neutralisation, S&P500 return on capital is on average 2.5% higher than Stoxx600.
9. Aswath Damodaran, Stern School of Business NYU, December 28 1998, Research & Development Expenses: Implications for Profitability Measurement and Valuation.
10. Warren Buffet, Chairman’s Letter, Berkshire Hathaway, 1999.
11. The biggest 1,500 stocks by market cap are ranked by net share repurchase as a % of market cap over a trailing 12-month period.
12. Utpal Bhattacharya & Stacey E. Jacobsen, Review of Finance, May 2015, The Share Repurchase Announcement Puzzle: Theory and Evidence.
13. Clifford Asness, Todd Hazelkorn and Scott Richardson, The Journal of Portfolio Management, Vol. 44 No. 5, Spring 2018, Buyback Derangement Syndrome.
14. Analysis from Bernstein estimate that 89% of 2018 buyback announcements were made by companies with market capitalisation in excess of USD10.7 billion, and 96% in excess of USD3.7 billion, the market caps of the 500th and 1000th largest companies in the US, respectively. Though not a perfect mapping, Russell 1000 is consequently the most appropriate index for judging trading impact. Russell 1000 value traded is approximately 20% higher than the S&P500.
You are now exiting our website
Please be aware that you are now exiting the Man Institute | Man Group website. Links to our social media pages are provided only as a reference and courtesy to our users. Man Institute | Man Group has no control over such pages, does not recommend or endorse any opinions or non-Man Institute | Man Group related information or content of such sites and makes no warranties as to their content. Man Institute | Man Group assumes no liability for non Man Institute | Man Group related information contained in social media pages. Please note that the social media sites may have different terms of use, privacy and/or security policy from Man Institute | Man Group.