Hopes for a soft landing may be dashed by economic reality, constraining many – but not all – major markets.
Hopes for a soft landing may be dashed by economic reality, constraining many – but not all – major markets.
December 2022
The numbers alone don’t fully convey the brutality of the present investment environment. Instead, consider the experience of one high-profile day trader who attracted a legion of followers after starting to comment on markets during the first Covid lockdown. A truncated timeline of his introduction to investing:
January 2021: “People have been doing this their whole lives. I’ve been doing it 10 minutes. I’m doing it better than they could ever dream of.”
December 2021: “I’m smarter than the algorithms.”
July 2022: “It’s a bloodbath.”
September 2022: “The whole thing makes no sense. We’re living in a matrix.”
Anyone who began investing soon after the pandemic lows probably did find it easy to make money: apps facilitated instant and apparently zero-fee stock purchases; the buzziest names quickly accumulated double- or even triple-digit returns.
My caution stems from the disconnect between a market currently priced for a soft landing and the increasing likelihood of a hard landing in reality.
Behavioural biases mean those now nursing hangovers in the aftermath of that binge may (if they haven’t been put off markets for life) retain a taste for what worked so well the first time. So might the professional investors who profited alongside them. There are, after all, superficially intuitive and compelling reasons for revisiting to what drove the last really – tech stocks in general, and especially the Nasdaq. Investors were sold a story of businesses with recurring subscription revenues, infinite scalability, vast addressable markets, and secular growth. Maybe they all still apply, but I would not be so confident in seeing this promise crystalise into performance over the next 12-18 months.
My caution stems from the disconnect between a market currently priced for a soft landing and the increasing likelihood of a hard landing in reality. Yet this does not mean I see no opportunities in the present environment; I will highlight three later in this article.
Hard Truths
The market recovery in November, spurred by a softer-than-expected US CPI print and associated hope that the Federal Reserve (Fed) will become more accommodative sooner rather than later, is one reflection of optimism around a soft landing. Another is the increasing interest in the term revealed by internet activity (Figure 1).
Figure 1. Google Trends Interest in ‘Soft Landing’ for the United States (Three-Month Moving Average of Percentile Ranking)
Problems loading this infographic? - Please click here
Source: Google Trends and Man Group; as of 1 December 2022.
We must remember, however, that soft landings are vanishingly rare. Since the end of the Second World War, there have been 12 full monetary-tightening cycles in the US. Of those, nine (75%) have ended in recession.1 In this context, it’s also worth noting that today’s tightening episode involves in the fastest increase in Fed policy rates since the US central bank resumed targeting the price rather than the quantity of money in late 1982.
These hikes are only one of the risks facing the economy. Another leading indicator is the build-up of inventories; this may seem a bit esoteric, but I think it explains the origin of the coming recession. For much of the developed world, the period since the start of the pandemic has brought a spectacular surge in consumer spending on goods, fuelled by monetary and fiscal emergency stimulus. Sales in the US wholesale channel – the intermediaries that sit between consumers and producers – are currently running $115 billion above the pre-Covid trend (Figure 2). This is the equivalent of seven years of pre-pandemic growth, a staggering step change in consumption.
Figure 2. US Merchant Wholesaler Sales, USD million, and Post-Dotcom Trend Line
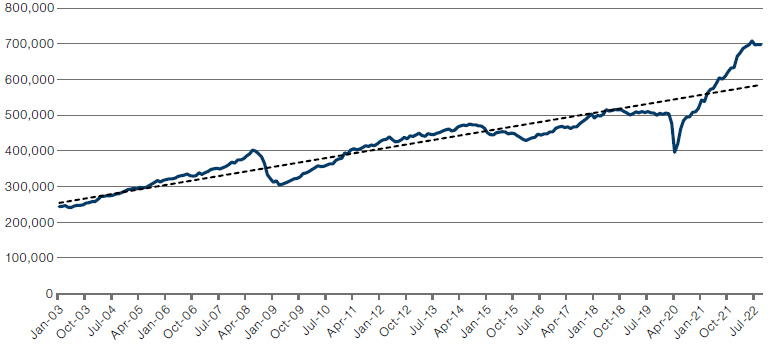
Source: US Census Bureau, Bloomberg and Man Group; as of 30 September 2022.
We know that supply chains initially struggled to keep up, production was disrupted everywhere by workers obliged to stay at home, and crucial components were stuck in containers in ports. Now, though, inventory channels have replenished (Figure 3). This is the fastest growth of real and nominal inventories in the history of the data, and it’s against the backdrop of slowing demand that problems are starting to emerge.
Figure 3. US Merchant Wholesaler Inventories, USD million, and Post-Dotcom Trend Line
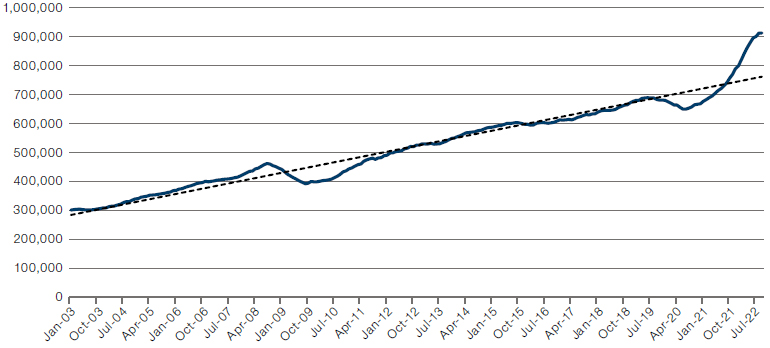
Source: US Census Bureau, Bloomberg and Man Group; as of 30 September 2022.
Since the second-quarter earnings season, we’ve started to see a repeated pattern of inventory impacts in financial reporting. Walmart2 was one of the first, acknowledging that consumer behaviour was changing with the mix shifting from general merchandise (meaning all those durable goods) to food. “One of the biggest impacts on our business this year has been the change in mix, particularly as we think about the US business where the margin profile is different on general merchandise versus food and consumables,” explained CFO John David Rainey on a November earnings call. “We don’t have an assumption that that bounces back rapidly next year. And with continued high prices, the consumer continuing to be pressured, we expect to have that mix effect prolong into next year.”
Cash flows for non-financial companies in the Russell 1000 have been deteriorating year-on-year.
That’s the experience downstream, but what does it mean for companies upstream? On the producer side, Thule3 is a maker of roof-storage accessories for vehicles. “Bike retailers were sitting with significant stock levels,” said CEO Magnus Welander in October. “We grossly underestimated their decisions to act in a very abrupt and very decisive manner to ensure that they didn’t continue to build up inventory, rather that they aggressively reduced inventory [by cutting orders].”
There are many, many more examples like these. In aggregate, our research suggests that this is already a real issue for US companies. Cash flows for non-financial companies in the Russell 1000 have been deteriorating year-on-year, driven by deteriorating working capital, which we think reflects the accumulation of inventories (Figure 4). This is the worst since the dataset begins over 15 years ago.
Figure 4. US Accruals Ratio
Problems loading this infographic? - Please click here
Source: Man Numeric; as of 15 November 2022. For illustrative purposes only. Spreads measure raw working capital accrual change on the Russell 1000 universe ex-Financials/REITS. Accruals are scaled by average assets.
These are not just micro impacts on individual companies; together, this economywide excess in stockpiles may induce a macro shock. Inventory dynamics tend to lead manufacturing dynamics by about six months; surges in inventory are typically followed by materially slowing production with a lag. Today, that relationship suggests that the ISM manufacturing survey will be in the low 40s sometime in the first half of 2023, a level that is consistent with a recession (Figure 5).
Figure 5. US Merchant Wholesaler Inventories & ISM Manufacturing
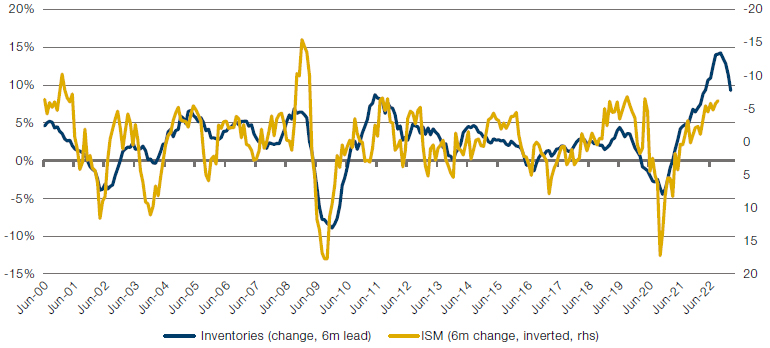
Source: National Association of Purchasing Managers, US Census Bureau, Bloomberg and Man Group; as of 1 November 2022.
What does this mean for earnings? The year-on-year change in the level of the ISM manufacturing survey typically leads earnings by around eight months. Based on the momentum described above and analysis of past earnings trends after ISM troughs, I believe a 15% decline in year-on-year earnings is a reasonable starting expectation (Figure 6).
Figure 6. Post-War ISM Troughs Below 45, EPS Drawdowns and CPI
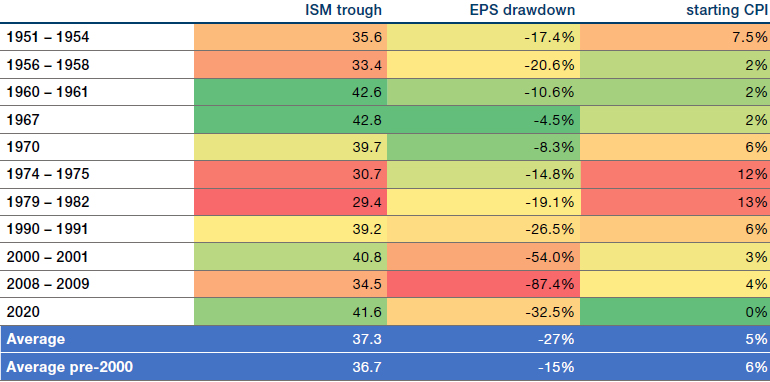
Source: National Association of Purchasing Managers, S&P Global, Bureau of Labor Statistics, Bloomberg and Man Group; as of 9 November 2022.
While we could tentatively conclude that high nominal inflation takes out the worst downside risks to earnings, in the past 70 years this has still not saved us from nominal earnings recessions.
For some context on the progression of consensus earnings estimates, 2023 forecasts have come down by about 5% since June – but are still 5% above 2022, and 2024 estimates are 9.5% above 2023.4 This is truly expected to be a magical cycle.
Perhaps high inflation can bail earnings out of a recession? Figure 6 highlights no obvious relationship between the starting level of inflation and the extent of an earnings recession across the whole sample. The high inflation of the 1970s saw earnings contract by 15-20%, which was similar to the low inflation of the late 1950s. On the other hand, in the three cycles post-2000 when deflation was a material risk, the earnings recessions were much more significant than those that preceded them. So, while we could tentatively conclude that high nominal inflation takes out the worst downside risks to earnings, in the past 70 years this has still not saved us from nominal earnings recessions.
Risk Premia Are Another Risk
Are investors being adequately compensated for the possibility of a hard landing? In equities, we can look at the spread of the earnings yield over the yield on the risk-free rate, a metric that tries to capture the premium investors are willing to pay for stocks over government bonds. For the S&P 500, this has now dropped to its lowest level since the global financial crisis (Figure 7). In essence, this demonstrates that the damage to equity prices has come entirely from the selloff in bonds; stocks have in fact become more expensive versus the risk-free rate this year.
Figure 7. S&P 500 Equity Risk Premium
Source: Morgan Stanley, Bloomberg and Man Group; as of 9 November 2022.
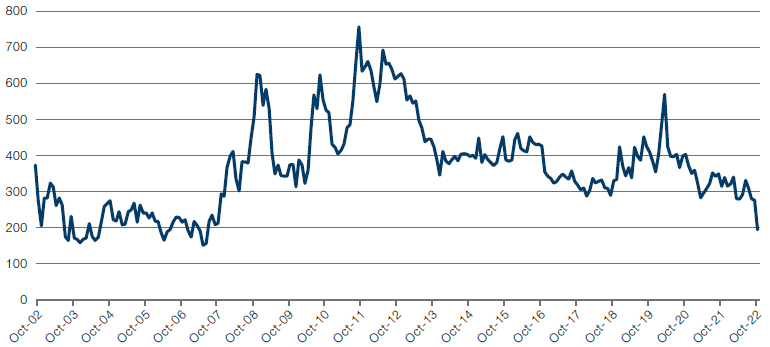
High-yield credit spreads are similarly low. We have about 50 years of data for US high-yield spreads; over that period; they averaged 640 basis points (Figure 8). Today, the spread stands at 470 basis points. During a recession, spreads typically widen to over 1,000 basis points; such moves from 500 to 1,000 basis points have often happened quickly, over the six months that the ISM crosses down from expansion territory to below 45.
Figure 8. US HY Spreads & NBER Recessions
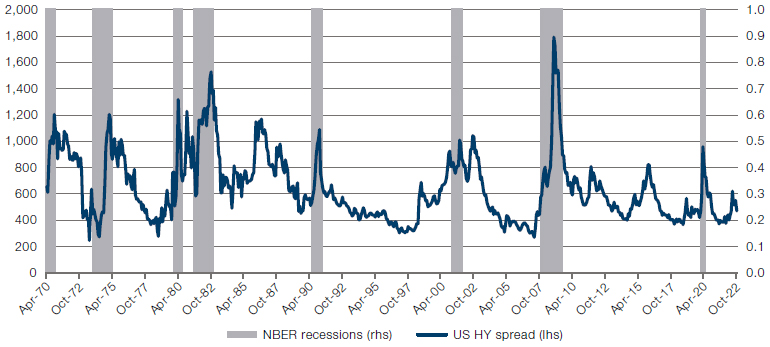
Source: WFD, Bloomberg and Man Group; as of 1 November 2022. The periods highlighted are exceptional and the results do not reflect typical performance. The start and end dates of such events are subjective and different sources may suggest different date ranges, leading to different performance figures.
Neither equities nor high yield, then, appear to be pricing in a slowdown. In our view, this introduces real asymmetry into both asset classes.
And Now For The Good News…
Despite all this, we should not be unduly pessimistic and overlooking the opportunities that are emerging. M2 – essentially easily available cash in US bank accounts, savings deposits, and money-market funds – expanded by more than 25% year on year in early 2021 (Figure 9). That growth has dropped down towards almost 0%, in October reaching the lowest such rate in the near 30-year dataset. This matters because the exceptional monetary impulse in 2020-21 significantly contributed to inflation; its dissipation may have the reverse effect. Inflation undershooting is not the consensus view at present: Bloomberg’s forecast for 2023 US CPI rose from 3.9% in October to 4.3% in November, with 85% of the sample expecting inflation to be above 3.5% in 2023.5 Cooler inflation could be as much of a shock next year as hot inflation was this year.
Figure 9. Money Supply Growth is Collapsing
Problems loading this infographic? - Please click here
Source: Bloomberg and Federal Reserve; as of 1 October 2022.
We expect this shift from inflation to disinflation – and the optimistic pricing of a soft landing – to create some compelling entry points to specific trades in 2023.
Change is the essence of opportunities, and we expect this shift from inflation to disinflation – and the optimistic pricing of a soft landing – to create some compelling entry points to specific trades in 2023.
First, my colleagues at Man Solutions have done a tremendous amount of work on understanding how asset prices are affected by different inflationary environments. They set out four distinct regimes, as described here. We were in what they term a fire regime of high and rising inflation between February 2021 and June 2022, which the long history of asset prices shows is normally negative for traditional bond and equity beta, and positive for commodities, trend and some equity long/short styles.
Their model indicates we are now starting a disinflation regime, in which one beneficiary has historically been long/short equity (Figure 10). The breadth of winning styles in this regime represents a compelling opportunity, in my view, for multi-factor equity risk premium strategies and multi-manager discretionary strategies, which cover a broad range of approaches and styles.
Figure 10. Equity Long/Short Style in Disinflation Regimes, US Aggregate Performance, Real Annualised Returns
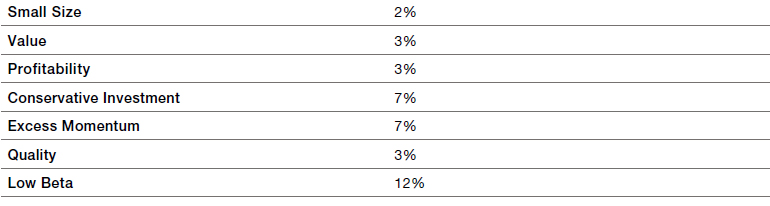
Source: Man DNA team using data from Professor Shiller, Fama-French and Morgan Stanley; based on analysis of data from 1926 to 30 June 2022. Disinflationary regimes defined as CPI falling on a trailing 12-month basis, without also being a fire or ice regime. All returns are total return. For further details on regimes and asset returns, please see our paper, The Best Strategies for Inflationary Times, available here.
While I believe equity long/short is attractive in today’s disinflationary conditions, I expect Asian equities to become more appealing in early 2023. The Asian economic cycle is, in our view, in an entirely different place from the West. We see inflation in the region as mostly derived from higher food and energy prices, compounded by a strong dollar, but not the labour-market tightness complicating policy in developed markets. The consumer also does not appear to be a source of inflation in Asia, as savings here did not accumulate to the same extent during lockdowns, and there is material spare capacity. When the Fed does pause its hikes, emerging economies should find the space to start easing their policy rates to support growth without the inflation risk faced by developed markets. A further boost could come from the potential for China to ease its Covid policy, which could be accelerated by the approval of a domestic MRNA vaccine.
The end of the downgrade cycle for Asia means it’s unlikely to de-rate further.
To this encouraging macro direction of travel, we can add the tailwinds of Asian earnings revisions already coming off their lows and heading back to zero while valuations remain low (Figure 11). For the first time in two years, we think consensus expectations for the region are achievable. Indeed, the backdrop for China reopening gradually and easier monetary conditions for the region in 2023 does introduce the possibility of a more bullish scenario, where earnings exceed expectations and revisions turn positive. Such upgrades are typically accompanied by a rerating of valuation multiples, as evident in Figure 11 too. This is significant because the end of the downgrade cycle for Asia means it’s unlikely to de-rate further, in stark contrast to what I expect in the US where earnings revisions should be going down and the fair multiple should fall too.
Figure 11. Asia-Pacific ex Japan Three-Month ERR Signal (YoY) vs Price to Earnings 12-Month Forward (YoY)
Problems loading this infographic? - Please click here
Source: Man Group database; as of 30 September 2022. ERR is an Earnings Revisions Factor designed by the GLG Quant team, using IBES estimates data, constructed from a bespoke Asia Ex Japan Universe – pre-costs.
Finally, we have already observed that high-yield spreads are currently below their past crisis peaks. Despite that, it’s still notable that even at present levels investors are compensated for an elevated implied default rate (Figure 12). A lengthening maturity profile in high-yield credit also means that refinancing requirements over the next 24 months are only 8% of the market outstanding, by our calculations; defaults typically only happen at refinancing rather than on coupon payments, implying a wall of defaults is not imminent and compensation is already available for a probable spike.
Figure 12. Implied Default Rates Have Moved Significantly Higher
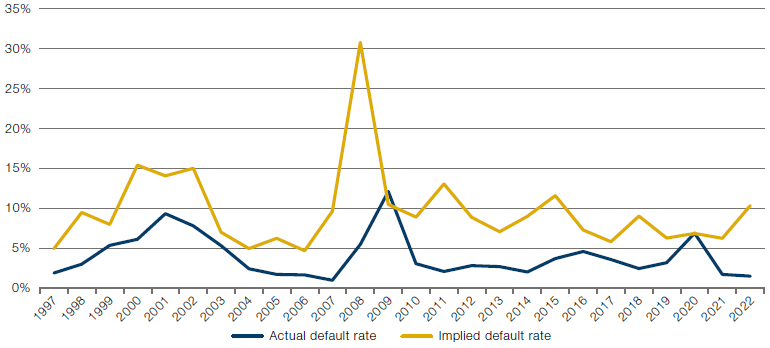
Source: Moody’s, ICE BofA, and Bloomberg; as of 30 September 2022. Implied default rates based on OAS of ICE BofA Global High Yield Index, assuming a 40% recovery rate.
This is, in my view, setting up a generational and exceptionally asymmetric opportunity in high-yield credit .
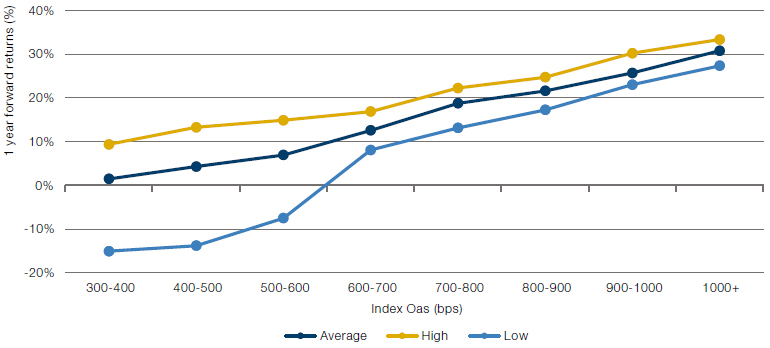
Moreover, when we look at the average one-year forward return based on the starting spread, we see that on average equity-like returns have been made one year forward at current spread levels (Figure 13). Above a spread of 600 basis points, all one-year returns have historically been positively bounded. By 800 basis points, the worst one-year return on record has been in the high teens. Overall, equity-like returns at roughly one-third of the volatility are evident. This is, in my view, setting up a generational and exceptionally asymmetric opportunity in high-yield credit – especially if spreads do widen further next year.
Figure 13. One-Year Forward Returns From Different Starting Spreads – Global High Yield (USD)
Source: Bloomberg, ICE BofAML Global High Yield Index and MSCI; as of 30 September 2022.
Conclusion
To summarise, the outlook is grim. A hard landing has overwhelmingly been the outcome during US hiking cycles, and the idiosyncrasies of the inventory cycle are today exacerbating this risk. We are already witnessing a drag on margins and manufacturing demand, which is likely to culminate in recession and lower corporate earnings. Equity valuations and credit spreads don’t yet reflect this risk. One positive outcome, however, could be a material and surprising amount of disinflation in 2023.
Investor choices need not be as miserable as the macro picture, however. In our view, there are three key opportunities emerging from this scenario. In order of immediacy, they are:
- Equity long/short, which has historically performed uniformly well in real terms across styles during periods of disinflation like today’s.
- Asian equities, where the macroeconomic and earnings cycle is materially different from the rest of the world and where central banks find themselves with the flexibility to be cutting rates as soon as the Fed pauses hiking, which could materialise early next year.
- High-yield credit, where we believe investors can be patient and then greedy in a hard landing later in 2023.
1. Source: Gerard Minack, Downunder Daily, 26 April 2022.
2. The organisations and/or financial instruments mentioned are for reference purposes only. The content of this material should not be construed as a recommendation for their purchase or sale.
3. The organisations and/or financial instruments mentioned are for reference purposes only. The content of this material should not be construed as a recommendation for their purchase or sale.
4. Source: Bloomberg; as of 24 November 2022.
5. Source: Bloomberg; as of 24 November 2022.
You are now exiting our website
Please be aware that you are now exiting the Man Institute | Man Group website. Links to our social media pages are provided only as a reference and courtesy to our users. Man Institute | Man Group has no control over such pages, does not recommend or endorse any opinions or non-Man Institute | Man Group related information or content of such sites and makes no warranties as to their content. Man Institute | Man Group assumes no liability for non Man Institute | Man Group related information contained in social media pages. Please note that the social media sites may have different terms of use, privacy and/or security policy from Man Institute | Man Group.