Discover our data-driven approach to Intelligent RI.

Looking to find
out more about responsible
investing at
Man Group?


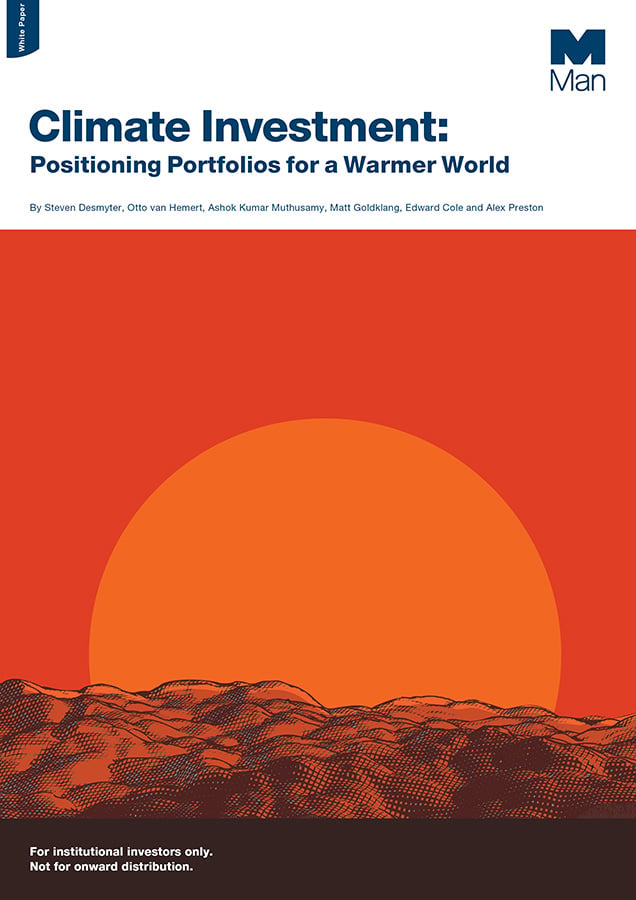
Download the report today and discover how investors can build climate resilience into their portfolios.
Get the full picture


It’s crucial to understand that temperature rises will not be distributed in a uniform way. While some countries will see little change in temperatures, others will be profoundly affected – even in optimistic scenarios. Our research employs Man Group calculations to estimate the impact of global warming on GDP per capita growth and how many working days per person may be lost by the year 2100.
Finding the winners and losers of a warming world


A warming world is a reality. Asset owners need now to think seriously about how this radically altered landscape impacts the companies and securities in their portfolios.
As stewards of capital and long-term investors, we need to be clear-eyed about the fact that change is coming and we need to prepare our portfolios accordingly. There will be winners and losers in the climate revolution and new tools are required to negotiate a world whose priorities will be unrecognisably different.
So what should investors do now?
A substantially warmer world requires investors to manage a number of risks including the cost of these even more intense extreme weather events.
Projections from the ‘code red’ assessment report published by the Intergovernmental Panel on Climate Change (IPCC), show that extreme events that typically occurred once every 10 years in a climate without human influence are now much more likely.
As a result of the world’s 1.2°C rise:
Extreme weather events are now more frequent and more intense


Using proprietary modelling data, this report gives investors a unique look at how economies and businesses alike will be affected by different climate paths and how portfolio resilience to climate risks can be improved.
As investors, we need to recognise this and start thinking now about how to position our portfolios for a future of higher temperatures. In a new report, Man Group climate experts have evaluated the science behind climate change and offer investors an insight into:
We are living in a warming world


Share


Find out more


Source: Estimated cumulative impact on GDP/capita growth due to climate change in 2100. Burke, Hsiang, Miguel (2015). Climate projections from Man AI Climate Change Computation Systems (MACCS) using SSP1-26 scenario from CMIP 6; as of 13 October 2021.
What will be the impact of 2°C warming
in the year 2100?
Source: Intergovernmental Panel on Climate Change Sixth Assessment Report, 10-year event frequency predictions calculated relative to average occurrences in a climate without human influence (1850-1900).


In a climate without human influence (1850-1900), these extreme weather events could be expected to occur once every 10 years on average.
Extreme weather event frequency per 10 years


Source: EM-DAT CRED; as of September 2021. Total losses adjusted at the 2019 US dollar value.
2019 – Currowan wildfires, Australia
Over five months, these fires destroyed over 10 million hectares and released as much smoke as a volcanic eruption.
1991 – Cyclone Gorky, Bangladesh
Over 15.4 million people affected by one of the deadliest cyclones on record.
2005 – Hurricane Katrina, US
The most economically damaging natural disaster in history with $164bn in total losses.
1960 – Valdivia Earthquake, Chile
The most powerful earthquake ever recorded, the resulting tsunamis affected New Zealand, Japan, Hawaii and more.


Natural disaster frequency 1960-2021

Droughts are now 0.3 standard deviations drier


Extreme heat spells are now 1.2°C hotter

Heavy precipitation events are now
6.7% wetter


Source: Met Office Hadley Centre, Ed Hawkins, Berkeley Earth. Temperatures reported as anomalies relative to the 1951-1980 average (regions) or the 1971-2000 average (world).
Human influence has warmed the climate at an unprecedented rate
The ways the climate crisis has affected financial markets so far;
The role of climate-focused investment;
How investors might position their portfolios for a warming planet;
Which economies might benefit from rising temperatures.
•
•
•
•


How investors can make better long-term decisions.
Climate Investment: Positioning Portfolios for a Warmer World


Download the report


Location


Company name


Job title


Company email


First name


Last name


Typical losers
Typical winners

While this decade has the lowest number of disasters in the past 62 years, the lack of early warning and response techniques made this decade the most dangerous.
1960-69

550
330
130
0
Natural disasters by year


World Africa Asia Europe North America Oceania South America


Israel
India
Qatar
Canada
Russia
Sweden
Most
common
Storms


Total
damages
$19bn

Total
disasters
602


Select a region to see how temperatures have changed over time:


1970-79
The disasters of the 1970s saw less than half the number of fatalities of the previous decade. However, the increased severity of storms more than doubled the economic cost.

911
Total
disasters

$54bn
Total
damages


Storms
Most
common


Humanitarian relief in the face of natural disasters came to national prominence following the severe droughts of the 1980s.


Storms
Most
common

$184bn
Total
damages

1,801
Total
disasters

1980-89


Increased epidemics, earthquakes and wildfires more than tripled the costs of the previous decade.


Storms
Most
common

$699bn
Total
damages

2,975
Total
disasters

1990-99


The frequency of natural disasters peaked in the early 2000s, coinciding with some of the worst ever recorded including Hurricane Katrina and the Indian Ocean earthquake.

Floods
Most
common

$892bn
Total
damages

4,476
Total
disasters

2000-09


Of the 10 most costly natural disasters in history, half have occurred in the past 12 years alone. Wildfires, flooding and storms have all increased in intensity as a result of global warming, threatening more and more of our communities.


Floods
Most
common

$1,900bn
Total
damages

4,444
Total
disasters

2010-21


Share this graphic

Share this graphic


Share this graphic


Download the report

Download the report

Download the report


Download the report

Mali
-53%

Kuwait
-53%

Niger
-54%
Losers

Canada
+61%

Russia
+80%

Finland
+89%
Winners
Source: Intergovernmental Panel on Climate Change Sixth Assessment Report
Climate without human influence (1850-1900)
No human influence


Heavy precipitation and flooding


Extreme heat events


Agricultural droughts
As today’s global temperatures have increased,
so has the frequency of extreme events.
1°C warmer world (today)


Even through limiting temperate rises to two degrees,
extreme heat events are likely to become very common.
2°C warmer world (projected)
Without major changes, nearly every year will contain an extreme heat event that would have occurred once per decade, alongside a high possibility of agricultural and flooding events.
4°C warmer world (projected)
1°C warmer world
2°C warmer world
4°C warmer world


Heavy precipitation and flooding


Extreme heat events


Agricultural droughts


Heavy precipitation and flooding


Extreme heat events


Agricultural droughts


Heavy precipitation and flooding


Extreme heat events


Agricultural droughts


Select a tab to see how extreme weather events are affected by changes in temperature:


Impact on GDP/capita growth

Positively affected

Negatively affected


Hover over the decades to learn more:

Share this graphic


Impact on GDP/capita growth
Source: Estimated labour workdays lost per person (high-risk industries) in 2100. Zivin and Neidell (2014). Man AI Climate Change Computation Systems (MACCS) climate change projections incorporating CMIP 6 SSP1-26 scenario; as of 13 October 2021.
Working days lost per person


30
0
Working days lost to climate change
15
Terms & Conditions
Privacy
Important Information
MKT002803/NS/GL/W/15102022

Scroll to learn more

2.5˚C
-1.5˚C
Relative temperature anomaly
ACCEPT ONLY
REQUIRED COOKIES
ACCEPT ALL COOKIES
Many of the interactive data visualisations and videos on this page need cookies to correctly function in your browser. You can find more information about the types of cookies Man Group uses and their purposes on our Cookies page.
This report page uses cookies


MKT002803/NS/GL/W/15102022
Important Information
Terms & Conditions
Privacy


Find out more

Discover our data-driven approach to Intelligent RI.
Looking to find out more about responsible
investing at Man Group?


Download the report today and discover how investors can build climate resilience into their portfolios.
Get the full picture

Download the report


Source: Estimated labour workdays lost per person (high-risk industries) in 2100. Zivin and Neidell (2014). Man AI Climate Change Computation Systems (MACCS) climate change projections incorporating CMIP 6 SSP1-26 scenario; as of 13 October 2021.
Working days lost per person


30
15
0
Source: Estimated cumulative impact on GDP/capita growth due to climate change in 2100. Burke, Hsiang, Miguel (2015). Climate projections from Man AI Climate Change Computation Systems (MACCS) using SSP1-26 scenario from CMIP 6; as of 13 October 2021.
Impact on GDP/capita growth


Positively affected
Negatively affected
Working days lost to climate change
Impact on GDP/capita growth
Click to interact

Click on the tabs to learn more:
What will be the impact of 2°C warming in the year 2100?


Share this graphic


Israel


India


Qatar
Typical losers


Russia

Sweden


Canada
Typical winners
It’s crucial to understand that temperature rises will not be distributed in a uniform way. While some countries will see little change in temperatures, others will be profoundly affected – even in optimistic scenarios. Our research employs Man Group calculations to estimate the impact of global warming on GDP per capita growth and how many working days per person may be lost by the year 2100.
Finding the winners and losers of a warming world


Download the report


A warming world is a reality. Asset owners need now to think seriously about how this radically altered landscape impacts the companies and securities in their portfolios.
As stewards of capital and long-term investors, we need to be clear-eyed about the fact that change is coming and we need to prepare our portfolios accordingly. There will be winners and losers in the climate revolution and new tools are required to negotiate a world whose priorities will be unrecognisably different.
So what should investors do now?

Share this graphic
Source: Intergovernmental Panel on Climate Change Sixth Assessment Report, 10-year event frequency predictions calculated relative to average occurrences in a climate without human influence (1850-1900).
Extreme events every 10 years

3

Heavy precipitation and flooding
9

Extreme heat events
4

Agricultural droughts
Without major changes, nearly every year will contain an extreme heat event that would have occurred once per decade, alongside a high possibility of agricultural and flooding events.
4°C warmer world
(projected)
2

Heavy precipitation and flooding
6

Extreme heat events
2

Agricultural droughts
Even through limiting temperate rises to two degrees,
extreme heat events are likely to become very common.
2°C warmer world
(projected)
1

Heavy precipitation and flooding
3

Extreme heat events
2

Agricultural droughts
As today’s global temperatures have increased,
so has the frequency of extreme events.
1°C warmer world
(today)
1

Heavy precipitation and flooding
1

Extreme heat events
1

Agricultural droughts
In a climate without human influence (1850-1900), these extreme weather events could be expected to occur once every 10 years on average.
Climate without human influence
(1850-1900)
4°C warmer world
2°C warmer world
1°C warmer world
No human influence
Click to interact


Click to see how extreme weather events are affected by changes in temperature:
Extreme weather event frequency per 10 years


Share this graphic


2010-21
2000-09
1990-99
1980-89
1970-79
1960-69
Source: EM-DAT CRED; as of September 2021. Total losses adjusted at the 2019 US dollar value.
Natural disasters by year

0
130
330
550
Click on the decades to learn more:
Natural disaster frequency
1960-2021


2019 – Currowan wildfires, Australia
Over five months, these fires destroyed over 10 million hectares and released as much smoke as a volcanic eruption.
Of the 10 most costly natural disasters in history, half have occurred in the past 12 years alone. Wildfires, flooding and storms have all increased in intensity as a result of global warming, threatening more and more of our communities.


Floods
Most
common

$1,900bn
Total
damages

4,444
Total
disasters
2010-21


2005 – Hurricane Katrina, United States
The most economically damaging natural disaster in history with $164bn in total losses.
The frequency of natural disasters peaked in the early 2000s, coinciding with some of the worst ever recorded including Hurricane Katrina and the Indian Ocean earthquake.


Floods
Most
common

$892bn
Total
damages

4,476
Total
disasters
2000-09


1991 – Cyclone Gorky, Bangladesh
Over 15.4 million people were affected by one of the deadliest cyclones on record.
Increased epidemics, earthquakes and wildfires more than tripled the costs of the previous decade.


Storms
Most
common

$699bn
Total
damages

2,975
Total
disasters
1990-99


1980 – Irpinia earthquake, Italy
With shockwaves felt from Sicily to the northern Po Valley, this devastating earthquake claimed almost 3,000 lives.
Humanitarian relief in the face of natural disasters came to national prominence following the severe droughts of the 1980s.


Storms
Most
common

$184bn
Total
damages

1,801
Total
disasters
1980-89


1977 – Extreme cold, United States
January 1977 was so cold that snow fell all the way to South Florida and for five days the temperature remained at or below freezing for 110 consecutive hours.
The disasters of the 1970s saw less than half the number of fatalities of the previous decade. However, the increased severity of storms more than doubled the economic cost.


Storms
Most
common

$54bn
Total
damages

911
Total
disasters
1970-79


1960 – Valdivia Earthquake, Chile
The most powerful earthquake ever recorded, the resulting tsunamis affected New Zealand, Japan, Hawaii and more.
While this decade has the lowest number of disasters in the past 62 years, the lack of early warning and response techniques made this decade the most dangerous.


Storms
Most
common

$19bn
Total
damages
602
Total
disasters
1960-69


Click to interact


Source: Intergovernmental Panel on Climate Change Sixth Assessment Report
A substantially warmer world requires investors to manage a number of risks including the cost of these even more intense extreme weather events.
Projections from the ‘code red’ assessment report published by the Intergovernmental Panel on Climate Change (IPCC), show that extreme events that typically occurred once every 10 years in a climate without human influence are now much more likely.
Droughts are now 0.3 standard deviations drier

Extreme heat spells are now 1.2°C hotter


Heavy precipitation events are now
6.7% wetter

As a result of the world’s 1.2°C rise:
Extreme weather events are now more frequent and more intense


Download the report

Source: Met Office Hadley Centre, Ed Hawkins, Berkeley Earth. Temperatures reported as anomalies relative to the 1951-1980 average (regions) or the 1971-2000 average (world).

2.5˚C
-1.5˚C
Relative temperature anomaly
Select a region from the drop-down list to see how temperatures have changed over time:
Human influence has warmed the climate at an unprecedented rate
Click to interact


Share this graphic
Using proprietary modelling data, this report gives investors a unique look at how economies and businesses alike will be affected by different climate paths and how portfolio resilience to climate risks can be improved.
•
•
•
•
The ways the climate crisis has affected financial markets so far;
The role of climate-focused investment;
How investors might position their portfolios for a warming planet;
Which economies might benefit from rising temperatures.
As investors, we need to recognise this and start thinking now about how to position our portfolios for a future of higher temperatures. In a new report, Man Group climate experts have evaluated the science behind climate change and offer investors an insight into:
We are living in a warming world


Scroll to learn more

How investors can make better long-term decisions.
Climate Investment: Positioning Portfolios for a Warmer World


Download the report


