As valuation spreads widen, the likelihood of a significant value rally increases, in our view. The question is when?
As valuation spreads widen, the likelihood of a significant value rally increases, in our view. The question is when?
March 24 2020
Quote of the Week:
"This bill is going to affect this country and the lives of Americans, not just for the next few days but in the next few months and years — so we have to make sure it is good."
An Opportunity in Value: So Near...
It has been a difficult couple of years for value investing, with 2020 even more challenging than the years before. However, a light may be appearing at the end of the tunnel for value investors.
Indeed, US large-cap industry- and sector-neutral valuation spreads are approaching more than six standard deviations, surpassing the peak reached during the Global Financial Crisis (Figure 1). Spreads have also widened in small caps, but are below the GFC peak (Figure 2).
In our view, the wider the valuation spreads, the higher the likelihood of a significant value rally. The question is when?
Figure 1. US Industry- and Sector-Neutral Valuation Spreads – Large Cap
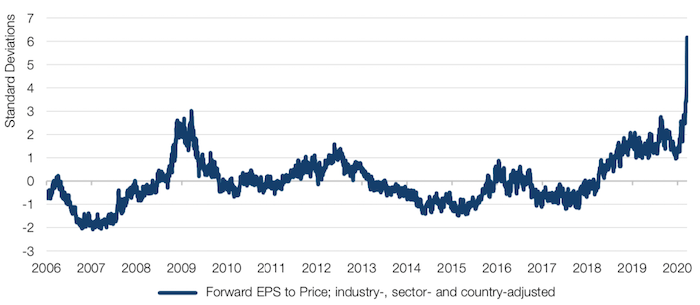
Source: IBES, Man Numeric; as of 18 March 2020.
Large cap denoted by largest 1,000 US stocks by market cap.
Figure 2. US Industry- and Sector-Neutral Valuation Spreads – Small Cap
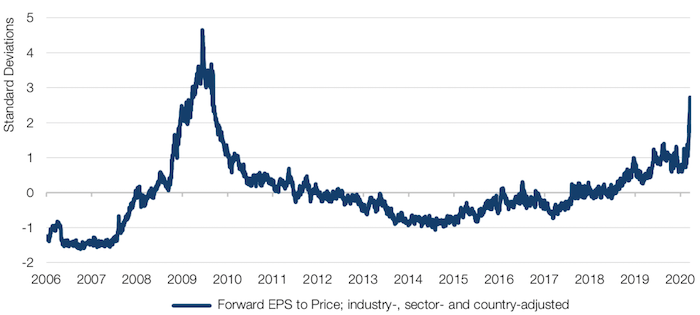
Source: IBES, Man Numeric; as of 18 March 2020.
Small cap denoted by the market cap of the largest US 1,000-3,000 stocks.
...Yet So Far
To attempt to answer that question, we looked at 21-day rolling sums of the spreads of momentum over value using Fama-French data going back to the 1920s. The data shows that the moves are at the 99th percentile when it comes to the outperformance of momentum versus value, similar to that experienced during the 1930s (the Great Depression), the 1980s (the Volcker Shock), 1999 (the dot com crash) or 2008 (the GFC).
So, is now a good time to be shifting into Value?
Our answer would be: not yet. While there have been two instance of hitting the 99th percentile trigger (illustrated by the yellow diamonds in Figure 4), history shows that a rally in Value usually occurs when there is a cluster of the triggers. We are yet to see a similar cluster in 2020.
Figure 3. Performance Spreads of US Momentum Over Value
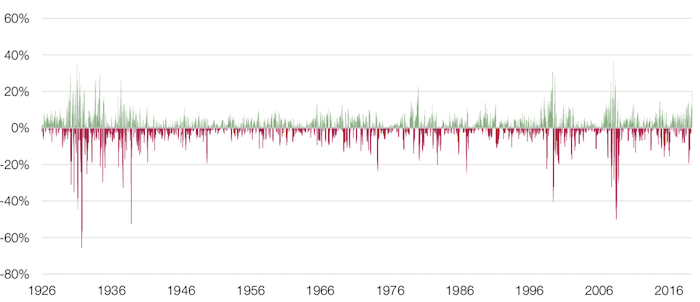
Source: Bloomberg, Man GLG; as of 16 March 2020.
Figure 4. Cumulative Returns of US Momentum Versus Value
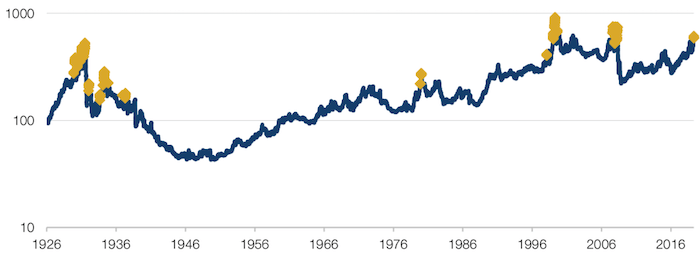
Source: Bloomberg, Man GLG; as of 16 March 2020.
Peace Comes Dropping Slow: Gross Positioning Falling, Vol Still Heightened
Perhaps not surprisingly, prime-brokerage data on gross positioning for equity long- short has experienced its fastest 3-month decline since data began in 2009, down 37 points from the gross in peak at the end of January (Figure 5).
The last time we had such a move was in September 2011, after the US sovereign debt ratings’ downgrade and amidst the Eurozone sovereign debt crisis. At the time, equities (as determined by the MSCI World Index) made a low about three weeks after gross positioning bottomed out.
However, crucially, the difference between then and now is that in 2011, volatility was calming down. Unfortunately, at the current juncture, there’s still a long way to go to achieve some sort of moderation in volatility.
Problems loading this infographic? - Please click here
Source: Bloomberg, Man GLG; as of 20 March 2020.
Pricing the Plague
Year-to-date, the S&P 500 Index is down 29%. What does that pricing imply about the market’s earnings expectations?
At the start of the year the sell-side expectation was for USD177 of earnings per share. If we assume the equity risk premium is 5% (the long-term outperformance of US equities over bonds), and a risk-free rate of 1.9% (the US Treasury 10-year yield at end-2019), we get to a discount factor of just under 7% at the start of the year. Assume a trend rate of growth of 3% per annum, and that all terminal values are constant.
Today, with the discount rate falling to less than 6% (due to yield declines), what is being priced to get to a 29% price decline on a discounted cashflow basis? There are a few different ways you could get to it. One is to assume earnings go to zero in 2020 (i.e. a 100% decline) and then do not revert to their pre-crisis trend for six years.
In an environment where it just needs one success in the myriad clinical trials currently being undergone to rapidly reconnect supply, this level of bearishness could quickly become outmoded.
With contribution from: Dan Taylor (Man Numeric, CIO), Ed Cole (Man GLG, Managing Director – Equities), Ben Funnell (Man Solutions – Portfolio Manager), Teun Draaisma (Man Solutions – Portfolio Manager) and Henry Neville (Man Solutions – Analyst).
You are now exiting our website
Please be aware that you are now exiting the Man Institute | Man Group website. Links to our social media pages are provided only as a reference and courtesy to our users. Man Institute | Man Group has no control over such pages, does not recommend or endorse any opinions or non-Man Institute | Man Group related information or content of such sites and makes no warranties as to their content. Man Institute | Man Group assumes no liability for non Man Institute | Man Group related information contained in social media pages. Please note that the social media sites may have different terms of use, privacy and/or security policy from Man Institute | Man Group.