What impact do school closures during a pandemic have on the economy? And comforting words from Jay Powell.
What impact do school closures during a pandemic have on the economy? And comforting words from Jay Powell.
March 10 2020
School’s Out! The Economic Impact of a Pandemic
The coronavirus contagion continues, prompting event cancellations and fights over toilet tissue as people begin to stockpile household goods. More importantly, the Covid-19 outbreak has disrupted education of nearly 300 million students globally as 13 countries — including China, Italy and Japan — have shut schools nationwide in an effort to stop the spread of the flu-like virus.1
So, what impact do school closures during a pandemic have on the economy?
In their academic paper ‘The Macroeconomic Costs of Global Influenza Pandemic’, Keogh‐Brown et al. have gone some way to answering that question.
The authors use different scenarios to run their analysis: the ‘base’ case assumes a clinical attack rate (‘CAR’) of 35% and a clinical fatality rate (‘CFR’) of 4 basis points, while the ‘severe’ case assumes a CAR of 46%. The CAR is an estimate of the number of individuals who are infected with the disease and the CFR expresses the percentage of infected individuals who die. Multiplying the CAR by the CFR provides the mortality rate. Note that the base-case scenario is relatively benign compared with the current effect of the virus – a base-case fatality rate of 0.04% is fully two percentage points below that of the Covid-19 strain. Both of these scenarios are mitigated by school closures (‘SC’) and antiviral (‘AV’) and vaccines. School closures are assumed to take place for either four or 13 weeks (Figure 1).
Figure 1. Scenarios
| Case Fatality Rate (%) | Clinical Attack Rate (%) | Mortality rate (%) | |
|---|---|---|---|
| Base | 0.04 | 35 | 0.01 |
| Base with 4 weeks SC | 0.04 | 33 | 0.013 |
| Base with AV and SC | 0.02 | 28 | 0.007 |
| Base with Vaccine and SC | 0.02 | 20 | 0.005 |
| Base with Vaccine, AV and SC | 0.01 | 16 | 0.02 |
Source: The Macroeconomic Costs of Global Influenza Pandemic’, Keogh-Brown et al; 2008.
Using these scenarios, the analysis estimates the change in GDP across Europe (Figure 2). What is striking is that the largest plotted impact occurs using the base-case scenario with four weeks of school closure, with losses from 5.8% for Italy to 7.9% for the UK. This scenario implies “unprecedented economic losses”, the authors write. The impact can be mitigated by the emergence of a vaccine and the use of anti-viral drugs.
Indeed, “school closures may be imposed for longer than the four weeks assumed in the results we have presented which would increase the economic impact and may reduce some parents’ ability to find short‐term care solutions that enable them to return to work.”
Figure 2. Gross Domestic Product (% change)
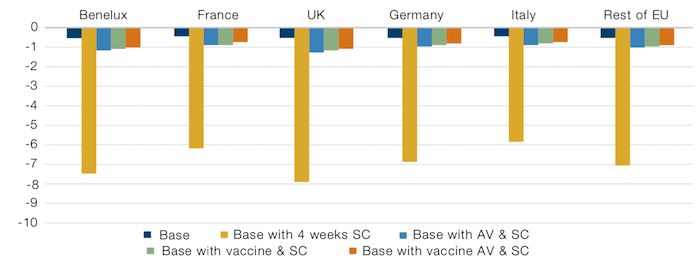
Source: The Macroeconomic Costs of Global Influenza Pandemic’, Keogh-Brown et al; 2008.
Everything Is Just Fine…
In times when we see a big, big selloff – a tooth-rattling, gut-churning selloff – the Fed tends to enact a little ritual. It is a piece of theatre as old as regulators themselves. The Chair of the Fed stands on a podium, and utters the fateful words: “The economic fundamentals are strong.”
We’d argue that this is par for the course when markets are in freefall. Trying to calm the markets has a history so long and venerable that Galbraith was writing about it in his The Great Crash, 1929: “Always when markets are in trouble, the phrases are the same. ‘The economic situation is fundamentally sound’ or simply ‘The fundamentals are good’. All who hear these words should know that something is wrong.”
Bernanke did it in 2007: “The global economy continues to be strong, supported by solid economic growth abroad. US exports should expand further in coming quarters. Overall, the US economy seems likely to expand at a moderate pace over the second half of 2007, with growth then strengthening a bit in 2008 to a rate close to the economy's underlying trend.”2
And, on 28 February, Jay Powell issued a statement saying: “The fundamentals of the US economy remain strong”.3
RIP, Oil
Oil prices fell by almost a third to USD30 per barrel on 9 March – on track for its biggest one-day drop since the 1991 Gulf War – as Saudi Arabia launched a price war. The move threatens to swamp the oil market with supplies just as Covid-19 hits demand, resulting in a 12 standard-deviation move in the price of oil, which (assuming a normal distribution) shouldn’t happen in the lifetime of the universe.
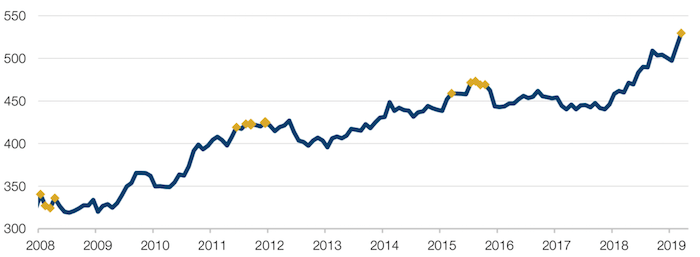
This large a drop in oil prices is likely to hurt producers around the world, particularly in Venezuela and Iran, whose oil-based economies are already under pressure from American sanctions. It would also add to financial pressure on American oil companies, many of which are highly indebted. Indeed, energy is the largest subsector among US junk-rated companies. As oil prices plunged, the iTraxx crossover index – a measure of the risk to sub-investment grade European companies – surged to more than 500 basis points on the morning of 9 March, before US credit markets even opened (Figure 3).
Figure 3. As Oil Prices Plunge, iTraxx Crossover Index Surges
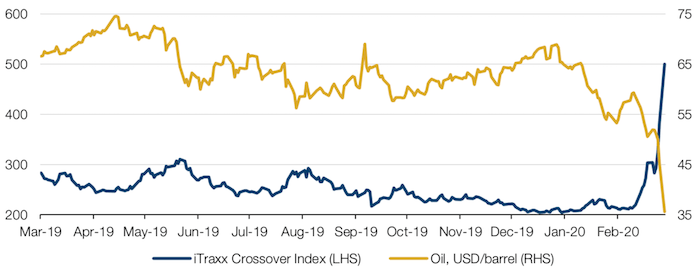
Source: Bloomberg; as of 9 March 2020.
Always the Bridesmaid: VIX Spikes and Value Performance Since 2009
The CBOE Volatility Index (VIX), returned to 9-year highs last week as the Federal Reserve announced a 50-basis point cut to contain the economic damages of the coronavirus.
This prompted us to look at previous steep moves in the VIX, and what history tells us (if anything) about market moves post those moves. Steep moves in the VIX are illustrated by the spread of the VIX spot to 8-month futures (Figure 4).
Figure 4. Spread of VIX Spot to 8-Month Futures
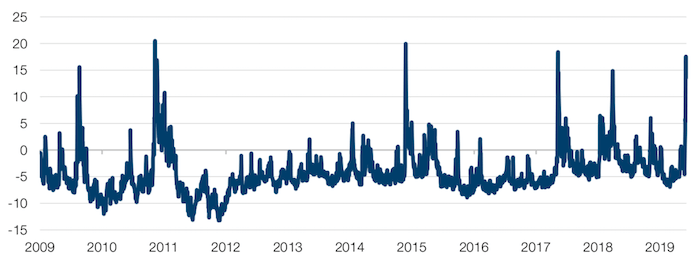
Source: Bloomberg; as of 9 March 2020.
Over the past 10 years, there have been four other notable instances where the spread has rocketed (Figure 5):
- May 2010 – the Flash Crash;
- August 2011 – The PIIGS sovereign debt crisis and US sovereign rating downgrade;
- August 2015 – China devaluation;
- February 2018 – Volmageddon.
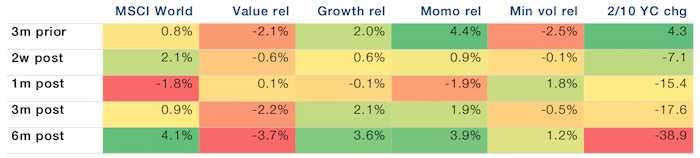
In all instances, we make the following observations (Figures 5-8):
- The factor that was performing the best on the way into the spike was also performing the best on the way out: In May 2010 and February 2018, it was Momentum; in August 2011 and August 2015, it was Min Vol;
- Value historically didn’t perform well.
Figure 5. Performance of Factors Before and After May 2010 Flash Crash
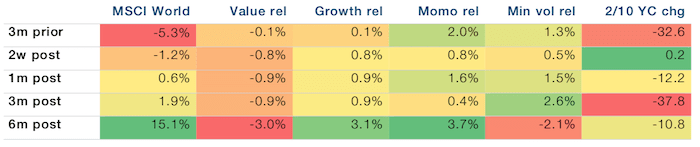
Figure 6. Performance of Factors Before and After August 2011
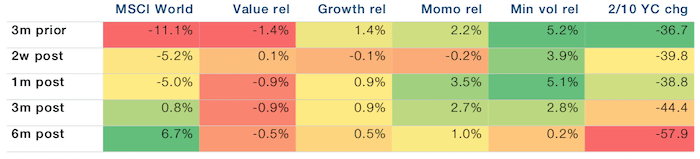
Figure 7. Performance of Factors Before and After August 2015 China Devaluation
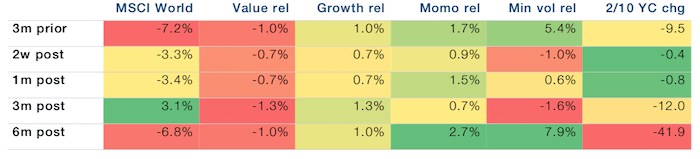
Figure 8. Performance of Factors Before and After February 2018 Volmageddon
Source: Man Group; as of 2 March 2020.
A Nasty JOLT
US job openings declined in December to their lowest level in two years, according to the Job Openings and Labour Turnover Survey (JOLTS). Furthermore, the 12-month net change in job openings has been negative for the last seven months. Indeed, when we look at growth breadth by industry i.e. the percent of industries seeing year-on-year growth in new job openings, that number is hovering around 0 (Figure 9).
This provides a counterpoint to US unemployment, which as of January 2020, was close to historic lows at 3.6%. In isolation, slowing or absent job growth is clearly bad for the economy. However, we make absolutely no prediction on the back of this observation – this is one data point, and whilst bulls should take it into consideration, it is important not jump to conclusions. To see a recession, we would not only expect to see job growth remain at these levels for a sustained period, but also see a marked uptick in unemployment – this would confirm to the pattern observed in 2008-9. Nevertheless, it’s a data point worth keeping in mind.
Figure 9. US JOLTS – Growth Breadth by Industry
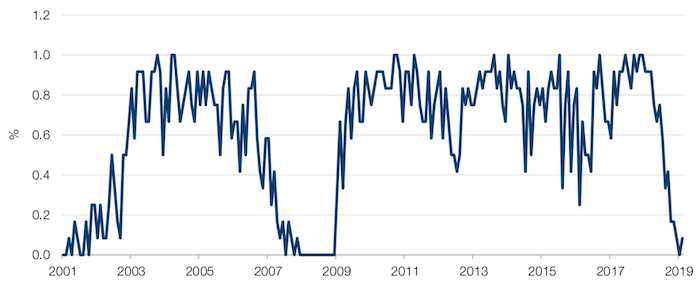
Source: Bloomberg; as of 4 March 2020.
Bonds: Low Marks on Risk/Reward
Howard Marks’s latest note, ‘Nobody Knows II’, argued that the risk/reward offered by 10-year US Treasuries was poor with yields hovering near all-time lows, especially when compared with a dividend yield of 2% on the S&P500 Index.
We felt it worth testing these claims – after all, an earnings yield of 2% at the top of the cycle can quickly become 1.4% if payouts revert to cycle lows.
Using monthly data, the first positive dividend yield spread was in 2009, with a few instances occurring since then. If we apply a 50 basis-point spread in favour of dividends as a trigger, 12-month forward returns for 7- to 10-year US Treasuries (on a total return basis) have been -3.1% on average.
Notwithstanding our concerns about dividends falling if the cycle ends, on a historical basis at least, Howard Marks is exactly right.
Figure 10. Instances of S&P500 Index Dividend Yield at 50bps Above 10-year UST Yield
Source: Bloomberg; as of 4 March 2020. Past performance is not indicative of future results.
Figure 11. Analysis Results
| Div yield/bond yield spread trigger | 0.50% |
|---|---|
| Count | 13 |
| Negative hits | 12 |
| Hit rate | 92% |
| Average 12m 7-10y returns | -3.1% |
| Max 12m return | 1.4% |
| Min 12m return | -6.0% |
| Unconditioned 12m return | 5.9% |
| Unconditioned negative hit rate | 20% |
Source: Man Group; as of 4 March 2020.
With contribution from’ should be: Ed Cole (Man GLG, Managing Director – Equities) and Matthew Sargaison (Man AHL, co-CEO and CIO.
1. Source: Unesco; as of 3 March 2020.
2. Mises Institute: ‘Ben Bernanke Was Incredibly, Uncannily Wrong’.
3. Statement from Federal Reserve Chairman Jerome H. Powell, 28 February 2020.
You are now exiting our website
Please be aware that you are now exiting the Man Institute | Man Group website. Links to our social media pages are provided only as a reference and courtesy to our users. Man Institute | Man Group has no control over such pages, does not recommend or endorse any opinions or non-Man Institute | Man Group related information or content of such sites and makes no warranties as to their content. Man Institute | Man Group assumes no liability for non Man Institute | Man Group related information contained in social media pages. Please note that the social media sites may have different terms of use, privacy and/or security policy from Man Institute | Man Group.