In this week’s issue: what does a Bernie Sanders presidency mean for markets; and the Covid-19 selloff in context?
In this week’s issue: what does a Bernie Sanders presidency mean for markets; and the Covid-19 selloff in context?
March 3 2020
Bern, Baby, Bern: Sanders and the US Economy
As Super Tuesday approaches, betting odds have Bernie Sanders winning 13 of the 14 contests.1 In our view, this makes examination of Sanders’s policies a necessity.
Other Democrat candidates have flagship policies. Not content with a single flagship, Sanders appears to have a whole fleet. A rough analysis would group them into policies which cost money, policies to raise revenue, and an amorphous broadside of ‘other’ reforms which nevertheless would have profound consequences for the US economy.
Sanders’s spending proposals encompass Medicare for all, by some estimates at a cost of more than USD30 trillion, a Green New Deal budgeted at around USD16 trillion (including USD2.5 trillion of investments and upgrades to the electric grid), ‘college for all’ policies offset by a financial transactions tax at an estimated net cost of USD50 billion, ‘jobs for all’ running USD30 trillion for 45 million government jobs, ‘housing for all’ at USD2.5 trillion and an expansion of social security of around USD2 trillion. This is by no means a comprehensive list – at the higher end of estimates, the full cost may be between USD80-100 trillion. In comparison, total US household wealth is currently USD82.5 trillion. At those levels, it more than doubles the size of the US government spending – to 70% of GDP – exceeding the government spending-to-GDP ratios of Sweden by 20 percentage points.
On the other side of the ledger, Sanders has proposed a Medicare payroll tax of 7.5%, projected to raise USD8 trillion. Of considerable interest to investors, the aforementioned financial transaction tax of 50 basis points on stocks and 10bp on bonds is not unique to Sanders, with a similar policy also proposed by Michael Bloomberg (albeit it at a much lower 10 basis points on stocks). Federal income tax would also be raised sharply for those earning over USD500,000. By some estimates, when added together, state, federal and income taxes could make the effective top tax rate close to 80%. Capital gains would be taxed as investment income, and a corporate tax hike to 35% would raise a putative USD2-3 trillion (but possibly more). All in all, Sanders’s proposal might raise around USD23 trillion. Additional policies include a ban on stock buybacks, the reintroduction of the Glass-Steagall Act separating investment and retail banking, a cap on the interest rates offered by credit card companies, possible caps on drug prices, a potential ban on fracking and defence cuts.
Comparisons are being made between Sanders’s policies to those of Jeremy Corbyn’s, who led the Labour Party off a cliff in the UK’s most recent general election. Indeed, in some ways, Sanders’s policies are even more radical than Corbyn’s. However, it is worth pointing out that there are some real differences in factors between Sanders and Corbyn, which could lead to a Sanders win, in both the nomination and the presidency. For the nomination, the sheer numbers of moderate candidates in primaries splitting the vote is acting in Sanders’s favour. For the presidency, Sanders leads Trump by 3-6 points nationwide.2 And while this may not translate to electoral college victories in swing states, a lot can happen between now and November.
So, what does this mean for financial markets under a Sanders presidency?
Based on his proposed policies outlined above, we believe the sectors which could be hard hit include banks, pharma, energy and defence. Given the extent of the proposed increase in government spending, questions might arise around the US sovereign debt rating. On the other hand, renewables, electric vehicle manufacturers and homebuilders are likely to benefit, in our view.
With all that said, given the expected makeup of the US congress, it seems unlikely that most (if any) of Sanders’s heavy-spending policies would even then make it into law. The most likely initial impacts would be regulatory (banks, fracking, etc) through executive orders. Voters and investors will be left having to handicap what policies might make it through and if the change will be incremental (likely, in our view) or revolutionary.
Nevertheless, we are still discussing policy proposals which use the term ‘trillion’ where previously we would expect ‘billion’. It is by no means clear that the economy has the capacity to invest Sanders’s trillions in a productive fashion. Unlike most primary candidates historically, Sanders will not move to the centre after winning the nomination – or the Presidency – as his ambitions are far more likely progressive.
Know a Place Called Vertigo: What Does a Market in Freefall Tell Us About Coronavirus?
Last week, the S&P 500 Index fell 11.4% in a week. What is the precedent for a move of this speed and scale? Since 1926, there have been only 15 other further instances where the US benchmark was down 10% or more from Friday close to Friday close. Some of these include (Figure 1):
- A cluster of nine weeks through the Great Depression between 1929-33;
- March 1938: the outworking of the infamous Federal Reserve policy mistake of 1937;
- May 1940: Nazi Germany enacts the Manstein Plan to conquer most of North- West Europe;
- October 1987: Black Monday;
- April 2000: DotCom Bust;
- September 2001: 9/11 terrorist attacks;
- October 2008: Lehmann Brothers bankruptcy.
So, some pretty weighty comparisons, it goes without saying. Sadly, there is little pattern in terms of what happens next. Of the 15 instances (excluding today) where the S&P 500 Index fell more than 10%, six experienced further negative performance over the subsequent 12 months and nine were positive. The worst-case scenario was -25%, the best +117%.
Which might it be this time around? Our hunch is that it’s more likely to be positive.
To illustrate, imagine three 10-year cashflow streams. The first is USD100 in Year 0 and grows at 5% a year. The second starts at USD100, falls to USD90 in Year 1 then grows at 5% a year. The third starts at USD100, falls to USD90 in Year 1, rises back to the trend level of stream one in Year 2, then proceeds to grow 5% a year. At a discount factor of 5%, the first stream is worth USD863, the second USD740 (a 14% discount) and the third USD849 (a 2% discount).
The scale of the current decline suggests that investors are pricing for stream 2 (a U- shaped recovery) rather than stream 3 (a V-shaped trajectory). In other words, Covid-19 is not a 1-quarter hit to earnings which is quickly recouped, but instead a sustained vandalism of earnings. If – come April/May – the warmer weather and medical advances chase the worst of the virus away, and with the Fed dropping hints of emergency easing, we could see some quite dramatic positive market moves.
Figure 1. S&P 500 Index – Down Weeks Since 1926
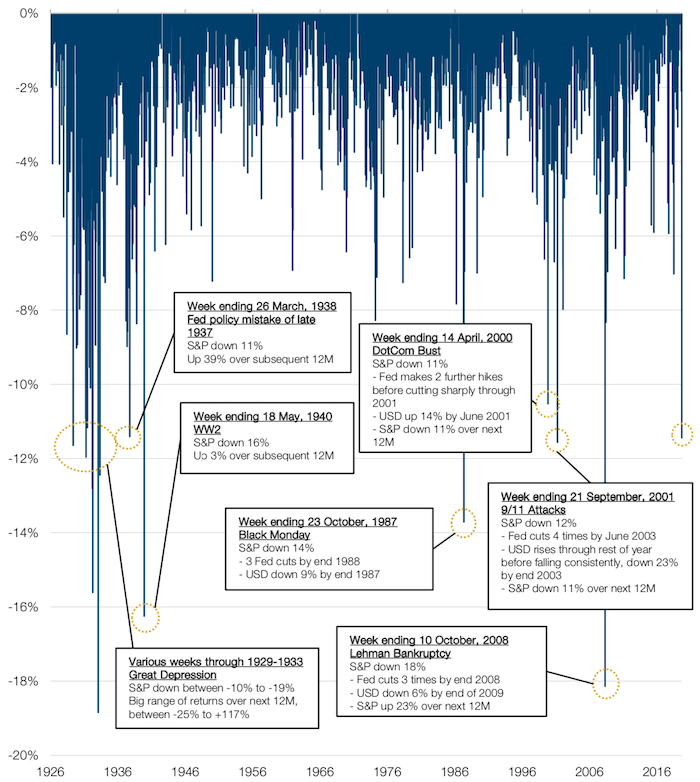
Source: Bloomberg, Kenneth French, Man Solutions; as of 27 February 2020.
Taxonomy of a Selloff
The equity selloff that has been precipitated by the spread of the coronavirus forces us to think hard about how to classify market downturns. Not all downturns are equally calamitous: the effect of the collapse of the TMT bubble in 2001 was of a different order of magnitude to the sell-off which was triggered by the collapse of Lehman Brothers in 2008. The former was an event whose effects were largely confined to the financial markets, the latter a full-scale banking crisis.
One way of thinking about the coronavirus is to place it within a threefold classification: a financial market event, a real-economy event or a banking crisis. The first could be defined as a large-scale derating, which has a minimal effect on growth rates; the second a selloff triggered by a catalyst which affects spending and growth in the real economy (thus causing market participants to sell their holdings in expectations of lower earnings); and the latter an event which not only encompasses the first two, but also causes the collapse of financial institutions and inhibits the creation of credit in the real economy.
The coronavirus selloff is clearly rooted in dislocation in the real economy. Despite positive news from China, anecdotally, we understand that many workplaces remain closed, with a consequential effect on supply chains for many businesses. Self- isolation also poses a threat to demand, as workers who remain at home reduce non- essential consumption.
However, the outbreak only escalates to a banking crisis if its duration persists. A short, sharp reduction in activity can be discounted in asset prices – a shock to earnings, whilst unwelcome, isn’t the end of the world. However, the danger lies if the slowdown in activity causes cashflow problems for businesses, creating non- performing loans for banks. A sustained quarantine in the US and Europe is necessary, in our view, to get a full-scale banking crisis.
Sittin’ On the Dock of the Bay
The Lunar New Year traditionally sees a predictable pattern of container movement in China. The numbers of containers waiting to be offloaded at Chinese ports steadily increases in the run up to the holiday, starting to dip a couple of days before and continuing to decline for about two weeks afterwards.
This year, however, the coronavirus has disrupted the pattern, with reports showing an unprecedented spike in the numbers of containers yet to be offloaded. This may explain the unexpected resilience of export data in countries like South Korea i.e. goods are continuing to be exported, but are just sitting in ports.
As such, we expect exports to China to soften over the next month or so, as restarted production copes with the backlog: next month’s export figures are likely to be weak driven by inventory literally sitting on the dock of the bay.
With contribution from: Peter van Dooijeweert (Man Solutions, Head of Institutional Hedging, Henry Neville (Man Solutions, Analyst), Andrew Freestone (Man Solutions, Portfolio Manager) and Ed Cole (Man GLG, Managing Director – Equities).
1. Source: Washington Examiner, Betting odds show Sanders winning 13 of 14 Super Tuesday races, 26 February 2020
2. Source: Various news reports.
You are now exiting our website
Please be aware that you are now exiting the Man Institute | Man Group website. Links to our social media pages are provided only as a reference and courtesy to our users. Man Institute | Man Group has no control over such pages, does not recommend or endorse any opinions or non-Man Institute | Man Group related information or content of such sites and makes no warranties as to their content. Man Institute | Man Group assumes no liability for non Man Institute | Man Group related information contained in social media pages. Please note that the social media sites may have different terms of use, privacy and/or security policy from Man Institute | Man Group.