In the aftermath of Boris Johnson’s election win, what does the future hold for the UK? And where did momentum go?
In the aftermath of Boris Johnson’s election win, what does the future hold for the UK? And where did momentum go?
January 14 2020
After the Blue Wave: The UK’s Post-Election Landscape
In the aftermath of Boris Johnson’s election win, what does the future hold for the UK?
In our view, 2020 may well see the UK economy surprise to the upside for two main reasons. First, history shows that after a Prime Minister secures a large majority in a General Election, UK growth is, on average, a percentage point higher (and inflation a percentage point lower) than the post-war average (Figure 1).
Secondly, we believe that consensus forecasts for UK growth in 2020 may be too low. Figure 2 shows consensus growth forecasts for private consumption, government consumption, fixed investment and inventories. We believe that fixed investment projections, specifically, may turn out to be too low. Fixed investment is itself comprised of around 20% government spending, 25% housebuilding and 55% business investment. Given Johnson campaigned on a platform of increased government spending, at least one component of fixed investment is very likely to receive a boost. Proposals to reform planning laws and an ongoing housing crisis may provide a similar boost to housebuilding. Most importantly, we believe that a more certain business environment post-Brexit, and an assertive government negotiating stance with the EU to get a trade deal, may unlock higher levels of business investment than consensus is anticipating.
Figure 1. Largest Parliamentary Majorities and Subsequent GDP and Inflation Growth
| Election | Winning Party | Elected Prime Minister | Seats Won | Average GDP Growth % (Election Year and Four Years After) | Average Inflation % (Election Year and Four Years After) |
|---|---|---|---|---|---|
| 2001 | Labour | Tony Blair | 413 | 2.8 | 2.1 |
| 1997 | Labour | Tony Blair | 418 | 3.5 | 1.2 |
| 1987 | Conservative | Margaret Thatcher | 376 | 2.7 | 7.0 |
| 1983 | Conservative | Margaret Thatcher | 397 | 3.8 | 5.4 |
| 1966 | Labour | Harold Wilson | 364 | 2.9 | 5.9 |
| 1959 | Conservative | Harold Macmillan | 365 | 3.8 | 2.2 |
| Average | 3.3 | 4.0 | |||
| Post-War Average | 2.3 | 5.3 | |||
Source: Bloomberg, Man GLG; as of 7 January 2020.
Figure 2. UK GDP Growth Forecast and Components – Consensus
| Consensus (%) | |
|---|---|
| Private Consumption | 1.5 |
| Government Consumption | 2.2 |
| Fixed Investment | 0.3 |
| Inventories (contribution to GDP growth) | -0.2 |
| GDP | 1.1 |
Source: Bloomberg, Man GLG; as of 7 January 2020.
We’re Not Holding Our Breath…
As everyone else was singing ‘Auld Lang Syne’, those anticipating the second coming of the September repo spike were glued to their Bloomberg terminals as the clocked approached midnight. They were disappointed. As we predicted before Christmas, no spike in overnight repo rates materialised this New Year.
We would attribute this to two factors. Firstly, we remain of the view that the Federal Reserve has the tools to keep control of overnight rates. After a further injection of USD76.9 billion on 6 January, it is clear that the Fed will continue to do what is necessary to keep the repo market functioning.
Secondly, the market itself is evolving to deal with its systemic issues. Banks are innovating to keep repo trades off their balance sheet and avoid triggering capital adequacy requirements. The first method which has been used is treasury return swaps, which synthetically replicate the return profile of repos and allow hedge funds to gain leverage without requiring any borrowing facility from banks, and, hence, the banks needing to fund them via repos. The second is sponsored repo, where fixed income clearing companies intermediate between banks and funds, netting off trades to reduce liabilities. Because banks are not directly engaging the fund on the opposite side of the repo trade, there is no requirement for them to register the trade as an asset or liability on their balance sheet when utilising sponsored repo. This means that there is no trading with non-US counterparties in ways that would trigger increased capital requirements.
In our view, these trends will reduce pressure on overnight funding markets, which will assist the Fed’s efforts to maintain control. Of the two factors, though, by far the most important is the provision of liquidity by central banks.
Figure 3. All Quiet on the Repo Front – Treasury Repo Rate
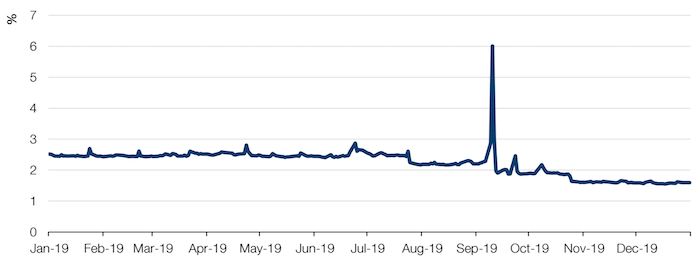
As of 8 January 2020.
Where Did Momentum Go?
One of the big stories of late 2019 was the relative underperformance of Momentum as a factor, following more than two years of strong performance.
This could partially be explained by the decline of the relationship between Utilisation and Momentum; Utilisation can be thought of as a proxy for shorting demand.
Traders often short companies that are expensive, or have poor Momentum or Quality scores. During the fourth quarter of 2019, traders appeared to cover shorts in negative Momentum names and put on shorts in positive Momentum names – which reduced the magnitude of the relationship between Momentum and short activity. Traders also appeared to cover shorts in cheap names, slightly increasing the relationship between Utilisation and Value.
On a separate note, on a cap-weighted basis, utilisation fell from 5.3% to 4.5% during the fourth quarter of 2019 (Figure 4). While this seems like a small change, it equates to a roughly 15% decline in shorting activity across our global universe.
The combination of these two may be reflective of a difficult environment for alpha generation, as well as a feeling that the prevalent trends of the last few years may be long in the tooth.
Figure 4. Utilisation on a Cap-Weighted and Equal-Weighted Basis
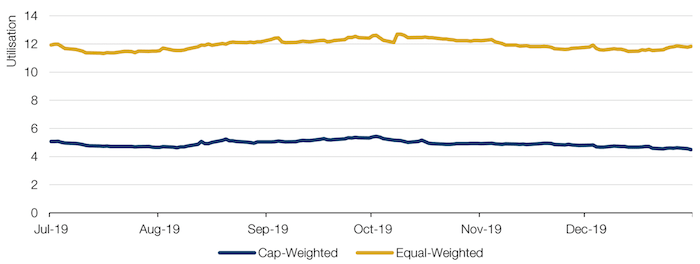
Source: Source: Man Numeric; as of 31 December 2019.
With contributions from: Henry Dixon (Man GLG, Portfolio Manager), Andrew Freestone (Man Solutions, Portfolio Manager), Dan Taylor (Man Numeric, CIO), Rob Furdak (Man Group, CIO), Ori Ben-Akiva (Man Numeric, Director of Portfolio Management) and Jayendran Rajamony (Man Numeric, Head of Alternatives).
You are now exiting our website
Please be aware that you are now exiting the Man Institute | Man Group website. Links to our social media pages are provided only as a reference and courtesy to our users. Man Institute | Man Group has no control over such pages, does not recommend or endorse any opinions or non-Man Institute | Man Group related information or content of such sites and makes no warranties as to their content. Man Institute | Man Group assumes no liability for non Man Institute | Man Group related information contained in social media pages. Please note that the social media sites may have different terms of use, privacy and/or security policy from Man Institute | Man Group.