In this week’s edition: lessons learned from the previous market crashes; systematic solvency concerns diminish thanks to the Fed; and the meaning of the moves in momentum.
In this week’s edition: lessons learned from the previous market crashes; systematic solvency concerns diminish thanks to the Fed; and the meaning of the moves in momentum.
April 21 2020
Quote of the Week:
"It just gets uglier from here."
A Brief History of Bottoms
Prior to the coronacrisis, there have been eight instances since the 1920s where the S&P 500 Index fell at least 25%. These are the bear markets which, like Banquo’s ghost at the feast, most haunt market memory. We show their progression in Figure 1, what happened after the initial 25% fall in Figure 2, and some summary statistics for each in Figure 3.
We note three lessons from history.
First, and at risk of stating the obvious, bear markets can be very deep and very long. For those wet behind the ears, there can be an instinctive assumption that for US blue chips, once you’re down a quarter in a quarter, that’s your lot. Well, try - 90% in the case of the Great Depression (Figure 1). Equally, as Figure 3 shows, the duration of many of these bear markets is two years or more of consistent, grinding misery. Moreover, and as per Figure 2, we can see that there is limited pattern once the bear market hits -25%. In four instances, the market was up over the next year, sometimes considerably so. In four instances, it was down over the next year, sometimes considerably so. All told, we could call the average flat, amongst friends. A challenge to call from here, in short. Having said that, it is worth noting that the corona-crash has not only been the fastest to -20%, -25% and -30%, but it has, thus far at least, been ‘V’ shaped in its recovery.
Secondly, the big bear markets tend to be driven more by multiple compression than earnings declines. Indeed, there are three instances where earnings actually rose through the crisis: in the post-war slump because there was a world to rebuild, irrespective of investor sentiment; in the oil crisis as inflation went north of 13%, providing a fillip for nominal earnings; and in the Black Monday crash, given it was driven by technical rather than fundamental activity. The current plunge has seen 12- month forward earnings decline about 14%, and yet the forward multiple has barely moved. If you’re a bear, this is where you’re looking for considerable downside.
Finally, Value tends to perform well during a bear market. There are some exceptions, of course. The Great Depression and the Global Financial Crisis were both disinflationary shocks, thereby boosting the worth of more expensive, longer duration equities. In World War II, with the Federal Reserve enacting financial repression, the Value factor was also hit for similar reasons. Otherwise, the results point in one direction: when panic hits, investors prefer jam today. Now, thus far through the coronacrisis, long/short US Value is down just over 21%. The drama may not be over yet.
Figure 1. The Great US Bear Markets
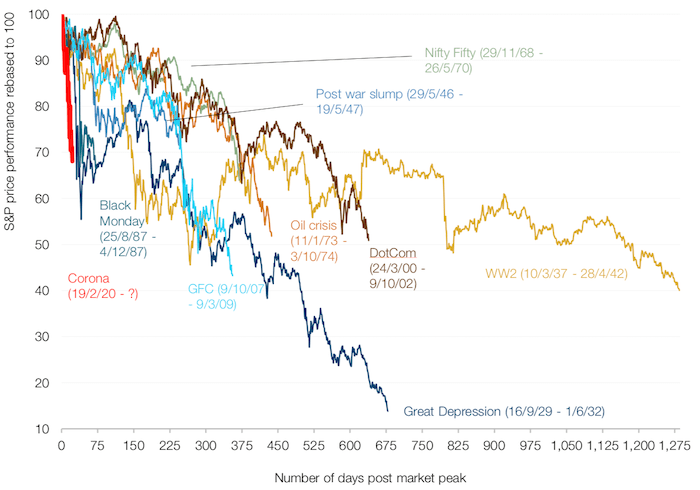
Source: Man Solutions, Shiller; as of 14 April 2020.
Figure 2. Price Action After a 25% Decline
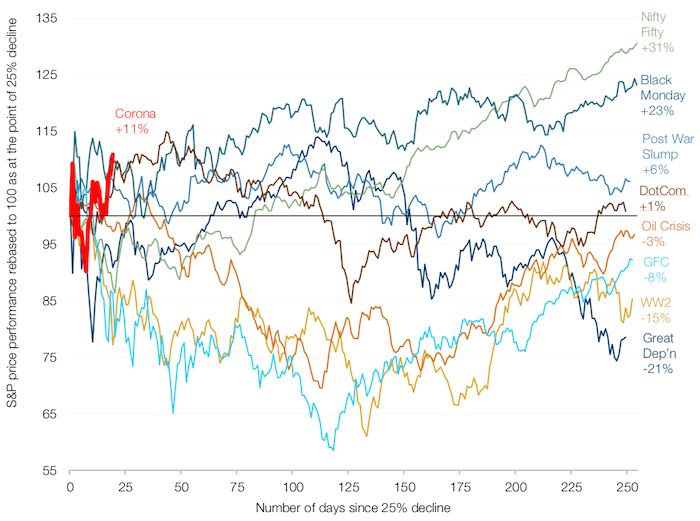
Man Solutions, Shiller; as of 14 April 2020.
Figure 3. Earnings and Factor Performance
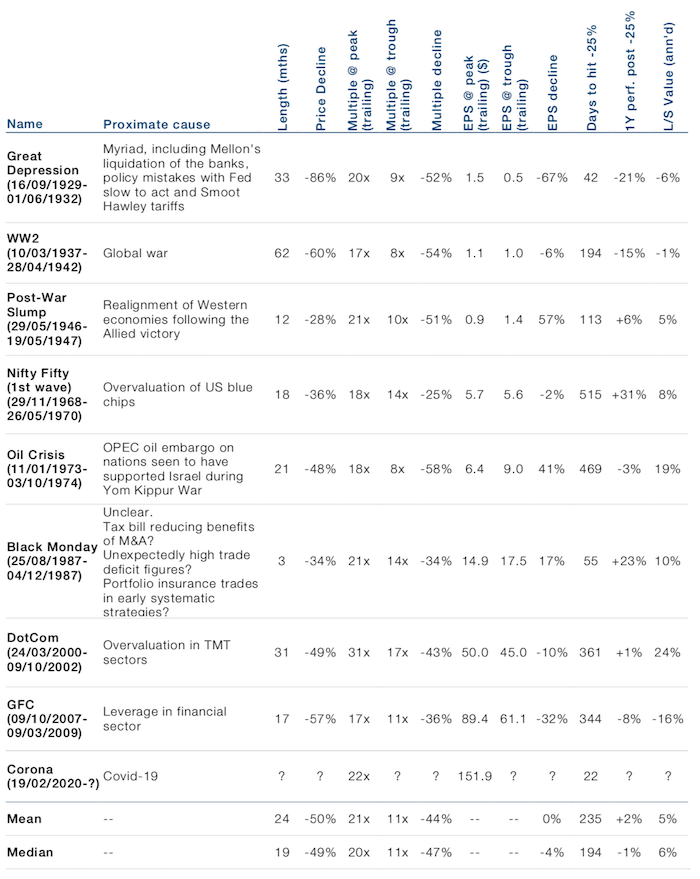
Source: Man Solutions, Shiller; as of 14 April 2020.
The Fed: Still Firing the Heavy Artillery, Market Still Jittery
Just when we thought the Federal Reserve had fired its last salvo during the coronacrisis, it surprises us with more stimulus, including:
- USD2.3 trillion in additional lending and asset purchases, expanding size and scope for the Primary & Secondary Market Corporate Credit Facilities. This offers up to USD750 billion of finance, including to fallen angels downgraded after 22 March, and to high yield ETFs;
- USD100 billion expansion of the Term Asset-Backed Securities Loan Facility, which offers collateral to cover previously issued AAA collateralised mortgage- backed securities and collaterised loan obligation AAAs;
- USD600 billion has been made available to for ‘Main Street’ borrowers, with up to 10,000 employees or USD2.5 billion in 2019 revenues. This is capped at 6x EBITDA for upsized tranches and 4x EBITDA for new loans, and priced at the secured overnight funding rate (‘SOFR’) +250-400 basis points (‘bps’), with the maximum upsized loan at USD150 million and new loan at USD25 million;
- A Municipal Liquidity Facility supporting states, cities and counties, with the Fed prepared to purchase up to USD500 billion in tax and revenue anticipation notes (i.e. selling receivables). Further term funding is offered for financial institutions involved in the federal governments’ Paycheck Protection programme.
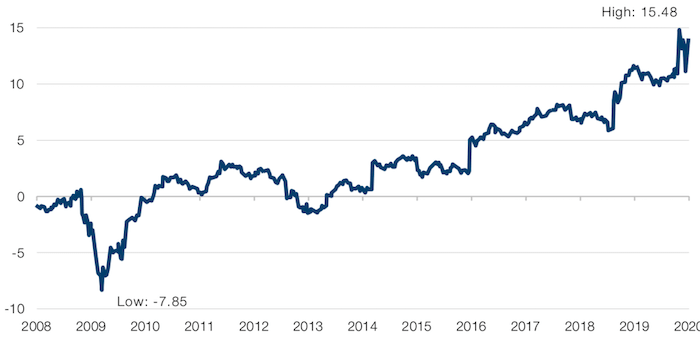
That’s quite a barrage, in our view, and it appears to have had the desired effect, with plunges in the equity risk premium of the S&P 500 Index’s and in US BBB corporate credit spreads (Figures 4-5). Indeed, the equity risk premium has normalised much faster than previous crises – the premium is back to April 2009 levels in just one month!
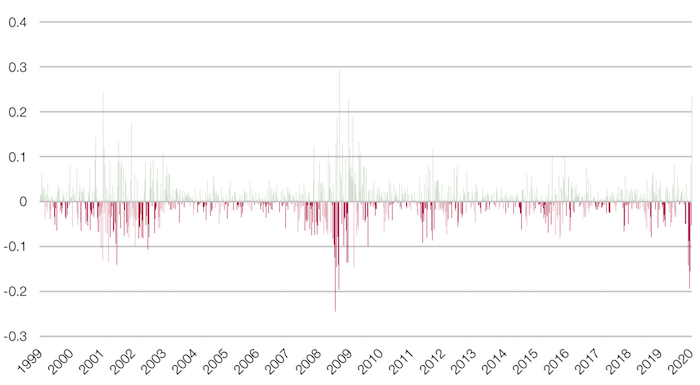
In the light of such support, what makes less sense is the continued premium placed on those companies with strong balance sheets (Figure 6). In our view, this premium is only explicable if the market believes that companies with weak balance sheets will struggle to recapitalise. That remains a risk, but with Fed support directly for high yield issuers, systemic solvency concerns are diminishing somewhat.
Figure 4. S&P 500 Risk Premium
Source: Bloomberg; as of 14 April 2020.
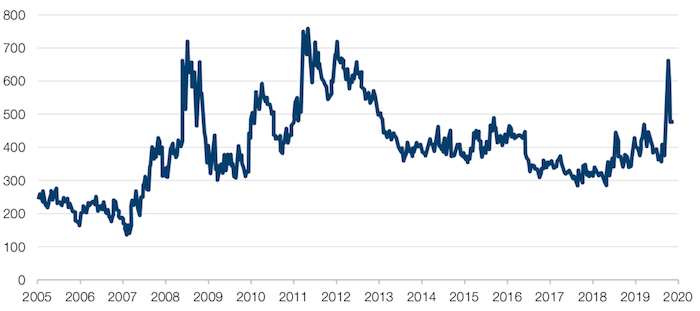
Figure 5. US BBB Corporate Credit Spreads
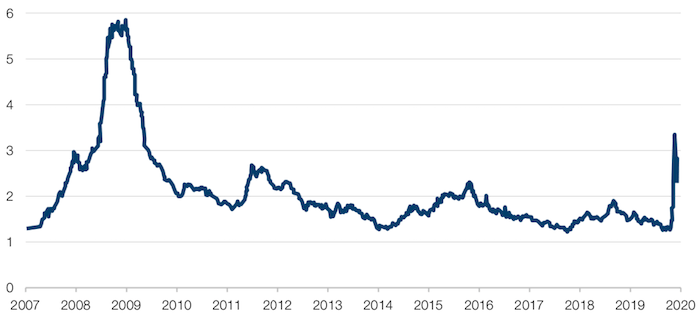
Source: Bloomberg; as of 14 April 2020.
Figure 6. Long/ Short US Strong Balance Sheets, on a Price to Earnings Basis
Source: Bloomberg; as of 14 April 2020.
Momentum Moves
Short momentum1 returned 23% in the week of 6 April, the third-largest 1-week move in more than 20 years. Indeed, since 1999, short momo has returned more than 20% in any one week only four times (Figure 7).
One would assume that a big move in any one week would unwind the next. However, our analysis has proved our instincts to be wrong. Using a 1-week return trigger of 20%, short momentum continued gaining even three months out (Figure 8).
Looking deeper, we would make the point that Momentum stocks had been largely comprised of growth stocks, often concentrated in the tech sector. This could be another indicator that the persistent underperformance of Value is coming to an end. Experience suggests, however, that major turns in regimes are rarely linear and that they’re bruising along the way. Patience is still a virtue.
Figure 7. Third-Largest 1-Week Move in Short Momo in More Than 20 Years
Source: Bloomberg, Man GLG; as of 10 April 2020.
Figure 8. Prior Losers Continued Losing
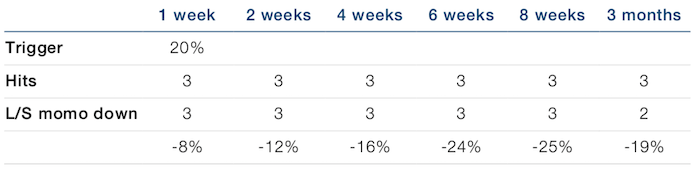
Source: Bloomberg, Man GLG; as of 10 April 2020.
With contribution from: Henry Neville (Man Solutions, Analyst) and Ed Cole (Man GLG, Managing Director – Equities).
1. Measured by Morgan Stanley’s short index.
You are now exiting our website
Please be aware that you are now exiting the Man Institute | Man Group website. Links to our social media pages are provided only as a reference and courtesy to our users. Man Institute | Man Group has no control over such pages, does not recommend or endorse any opinions or non-Man Institute | Man Group related information or content of such sites and makes no warranties as to their content. Man Institute | Man Group assumes no liability for non Man Institute | Man Group related information contained in social media pages. Please note that the social media sites may have different terms of use, privacy and/or security policy from Man Institute | Man Group.