European and UK banks have halted dividend payments. This could turn out to be short-term gain for long-term pain, in our view.
European and UK banks have halted dividend payments. This could turn out to be short-term gain for long-term pain, in our view.
April 7 2020
Quote of the Week:
"[Job claims] tells you that government programmes are too late, and companies have already reacted."
European Banks: Damned if They Do, Possibly Damned if They Don’t
A consortium of UK banks - Lloyds, RBS, Barclays, HSBC, Santander and Standard Chartered – have agreed to cancel 2019 and 2020 dividends payments at the urging (but not the direct behest) of the Prudential Regulation Authority. This move follows one made by the European Central Bank, which has ordered eurozone banks to halt dividend payments and share buybacks, and has since been mirrored by the New Zealand central bank, which also ordered the nation’s banks to stop paying dividend.
The logic behind withholding dividends is comprehensible: European banks are able to keep cash on their balance sheets, providing greater levels of resilience during the crisis and keeping capital ratios high in the face of the almost inevitable provisions for non-performing assets. It is that latter point which we believe the regulator cares most about. Without maintaining high capital ratios, banks will be unable to engage in much new lending activity, which will impede any recovery. Cancelling dividends also has political benefits.
However, this move does pose problems in the long term. Even before the current crisis, the European banking sector traded below book value and showed little in terms of EPS growth. Market sentiment effectively precluded much chance of re- rating. The only inducement to owning bank stocks was their dividends, which were consistently good.
However, if a bank needs to issue equity over the next 12 months (and with so little clarity on the duration of the coronavirus, who is to say they won’t?), it will be issuing it into a void, with a much higher cost of capital. In our view, that in itself reduces any incentive for banks to lend, particularly at a point when there is an economy-wide solvency crisis everywhere. So, rather than bolstering capital to fuel further lending, banks are indirectly incentivised to sit on their hands. And without EPS growth, the prospect of multiple expansion and now shorn of dividend income, what earthly reason would attract investors to buy a European bank?
In contrast, the US bailout package contains good news for the American banking sector. The USD2 trillion stabilisation package includes USD350 billion in loans for SMEs with less than 500 employees. Banks are being compensated for processing and administering the loan, with the federal government to pay fees varying by loan size: up to 5% for loans under USD350,000, and 1% of loan value of up to a threshold USD2 million in total fees.
Of course, banks aren’t the risk-takers in the US, so one could argue that the comparison with Europe is unfair. However, this still illustrates the US understands that solid ROEs are essential if banks are to play a part in making credit flow properly.
The Rise of the Fallen Angels
Credit rating agencies have definitely been busy lately, with high-profile companies such as Ford, Occidental Petroleum, Kraft-Heinz and Macy’s being stripped of their investment-grade credit ratings.
These downgrades has taken the year-to-date quantum of ‘fallen angels’ – a term given to companies that lose their coveted investment-grade credit rating – to USD120 billion in the US and EUR30 billion in Europe. Indeed, on a rolling 12-month basis, the absolute amount of corporate fallen angels in the US dollar market is currently at the TMT-bust peak of 2001 and above the General Motors/Ford correlation crisis of 2005, the Global Financial Crisis of 2008 and the commodity sell- off in 2016. However, it is still considerably below the first three in proportional terms, at only 5% of total so far. The picture for EUR corporate bonds is similar (Figures 1-4).
Figure 1. US Dollar 12-Month Trailing Fallen Angels by Volume
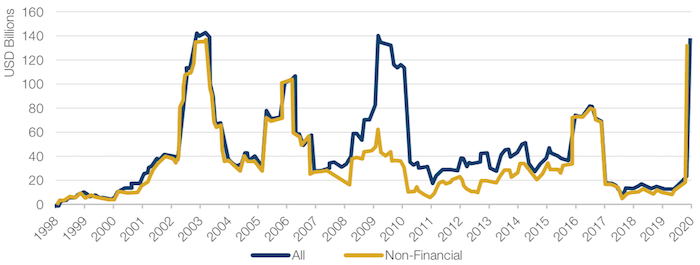
Source: Deutsche Bank, ICE Indexes; as of 30 March 2020.
Figure 2. US Dollar 12-Month Trailing Fallen Angels as a Percentage of BBBs
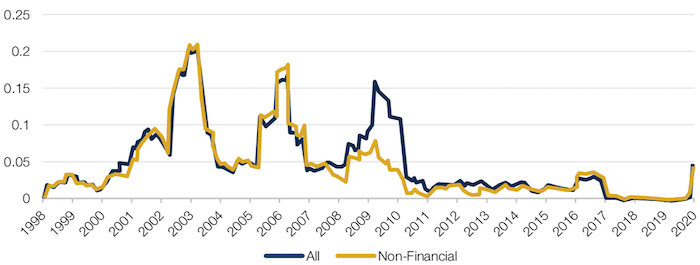
Source: Deutsche Bank, ICE Indexes; as of 30 March 2020.
Figure 3. Euro 12-Month Trailing Fallen Angels by Volume
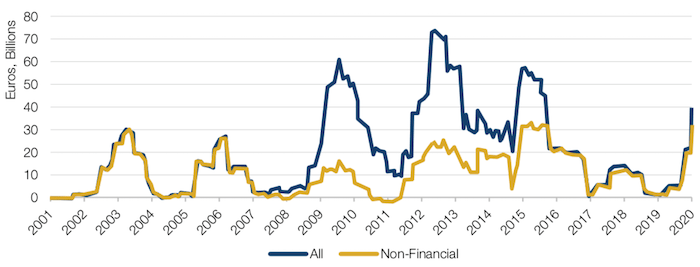
Source: Deutsche Bank, ICE Indexes; as of 30 March 2020.
Figure 4. Euro 12-Month Trailing Fallen Angels as a Percentage of BBBs
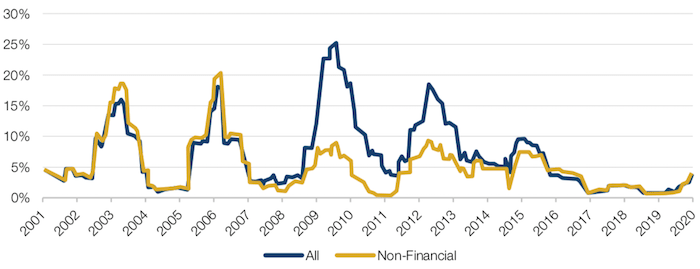
Source: Deutsche Bank, ICE Indexes; as of 30 March 2020.
The reason why LTM fallen angels are at peak levels in absolute amounts but not on a percentage basis reflects the massive growth since the GFC. Since 2008, the annual global issuance of corporate bonds has averaged USD1.8 trillion, double the annual average between 2000 and 2007. More importantly, in 2019, the portion of BBB rated bonds accounted for 51% of all investment grade issuance. Between 2000 and 2007, the portion was just 39%.1
As such, the notional of fallen angels is potentially much bigger now.
But just how much bigger are we talking?
Estimates for a downgrade to fallen angel status range from 10% (similar to GFC) to 15% (which would still be better than during the TMT-bust or the correlation crisis). At 10%, we would see a further USD100 billion of corporate downgrades in the US and EUR50 billion in Europe. This would increase high yield in the US and Europe by 10% and 20%, respectively. At 15%, we would see a further USD300 billion of corporate downgrades in the US and EUR110 billion in Europe. This would increase high yield in the US and Europe by 25% and 40%, respectively.
The downgrades we’ve seen may look bad. But we may have a whole host of fallen angels, not just a couple of heralds, by the time this is all over, in our view.
First Coronavirus, Then FX: Singapore’s Wars
Singapore has been a poster child in how to tackle the coronavirus. The Singaporean government showed alacrity in closing its borders and introducing aggressive testing (Singapore had conducted 38,000 tests, or about 6,800 examinations per million population as of March 20, outpacing South Korea2), alongside leading in terms of the timing and size of its fiscal stimulus (an overall relief plan of 55 billion Singapore dollar is about 11% of its GDP, the first part of which was announced in February).3
Despite these measures, the city’s GDP growth in the first quarter of 2020 plunged an annualised 10.6% per cent from the previous quarter, the sharpest drop in a decade.
And on 30 March, the city also fired the first shot in the currency war. Figure 5 shows an excerpt from the monetary policy statement issued by the Monetary Authority of Singapore, which said that despite having a current account surplus of 17% of GDP in 20194, it was committed to zero nominal FX appreciation, even after a small devaluation of the Singaporean dollar.
Indeed, Singapore embraced the same policy in 2016 after China devalued its currency in 2015 and then cracked down on bearish yuan bets in 2016. These actions yielded positive results: Singapore’s GDP growth in the fourth quarter of 2016 rebounded to more than 7% (Figure 6).
Figure 5. Excerpt From MAS Monetary Policy Statement
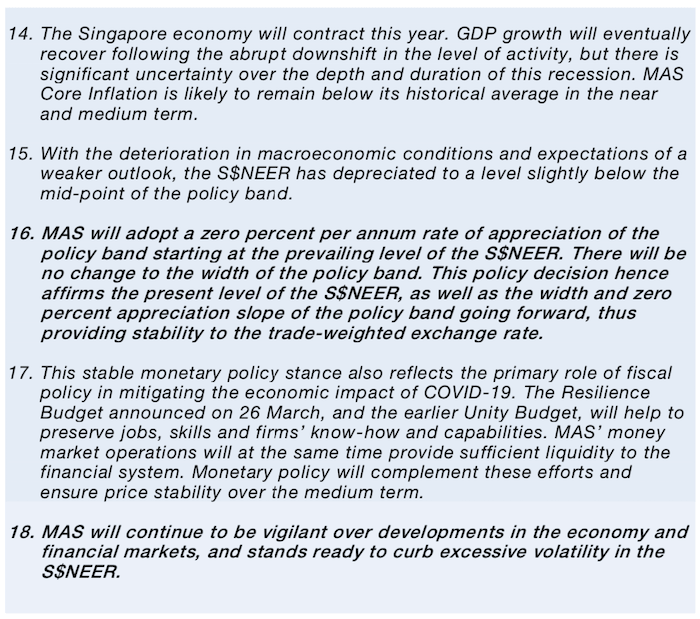
Source: Monetary Authority of Singapore; 30 March 2020.
Source: Trading Economics; as of 1 April 2020.
Problems loading this infographic? - Please click here
The Eye of the Storm
The Bank of America MOVE Index – which measures the volatility in the Treasury market implied by option pricing – leapt to 163 in March as the impact of the coronavirus ricocheted through markets. This was mirrored by the moved in the VIX Index, which peaked at 85.5 last month.
However, aggressive actions by the Federal Reserve have stabilised the ‘40’ of 60/40 equity/bond portfolios. The MOVE Index, which reached nowhere near the 2008 high, has since fallen to 88.5 Equity volatility, on the other hand, has been much slower to react, with the VIX eclipsing the 2008 peak before falling to 60 (Figure 7).
These actions by the Fed – including an acceleration of its purchases of Treasuries and an announcement of seemingly unlimited asset purchases – have allowed gold and FX to normalise and has stopped the scary sell-off/cash raise in fixed income.
However, this provides only temporary respite. Market focus has now shifted from the liquidity downward spiral to solvency issues in credit and EPS and economic issues in equities, none of which have been solved...
Source: Bloomberg; as of 30 March 2020.
Problems loading this infographic? - Please click here
Brokers, Liquidity and Spreads
When markets become volatile, liquidity is often thought to have dried up. Assessing the levels of liquidity for a given asset is an important determinant of the severity of a crisis: an absence of liquidity invariably means that markets are stressed to the point of collapse.
One method of measuring the impact of crises on market liquidity is through assessing the trajectory of broker spreads. As markets become more volatile, we would expect brokers (in their capacity as market makers) to widen their spreads, reflecting the increased uncertainty of prices and therefore the greater risks brokers are running when buying and selling.
Figure 8 shows Man Group’s data on broker spreads on interest rate swaps. As illustrated, the average bid-ask spread offered by brokers has increased by roughly 3 basis points since the advent of the Coronacrisis in late February. Not only have the average spreads increased, but the range of spreads offered has also increased, from around 2bp pre-crisis to around 4bp.
What does this mean in context? In our view, it means that whilst the swaps market is undergoing a period of stress, we are well away from financial meltdown: we are still talking about spread increases of a few basis points, which, whilst materially worse than a few months ago, is not an apocalyptic scenario. Indeed, we might go further. Given the stress of the global pandemic, markets are functioning relatively well.
Figure 8. Interest Rate Swaps Bid-Ask Spreads (Basis Points)
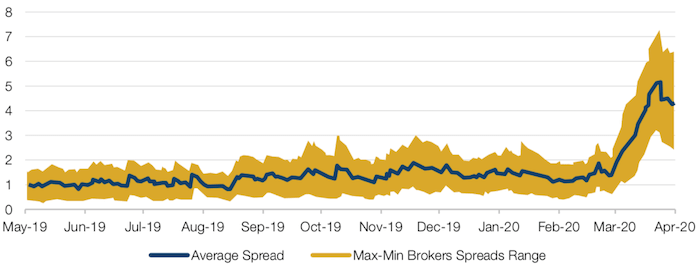
Source: Man Group; as of 3 April 2020.
With contributions from: Andrew Freestone (Man Solutions, Portfolio Manager), Ed Cole (Man GLG, Managing Director – Equities), and Matthew Sargaison (Man AHL, Co-CEO and CIO).
1. Çelik, S., G. Demirtaş and M. Isaksson (2020); Corporate Bond Market Trends, Emerging Risks and Monetary Policy; OECD Capital Market Series, Paris.
2. Source: Financial Times, How Singapore Waged War on Coronavirus, 22 March 2020.
3. Source: Financial Times, Singapore Unveils $34 Billion Coronavirus Relief Package, 26 March 2020.
4. Source: Fitch.
5. As of 30 March 2020.
You are now exiting our website
Please be aware that you are now exiting the Man Institute | Man Group website. Links to our social media pages are provided only as a reference and courtesy to our users. Man Institute | Man Group has no control over such pages, does not recommend or endorse any opinions or non-Man Institute | Man Group related information or content of such sites and makes no warranties as to their content. Man Institute | Man Group assumes no liability for non Man Institute | Man Group related information contained in social media pages. Please note that the social media sites may have different terms of use, privacy and/or security policy from Man Institute | Man Group.