How many standard deviations? Momentum and Value change places; Iran and China thumb the nose to the US; and EPS forecasts are way off.
How many standard deviations? Momentum and Value change places; Iran and China thumb the nose to the US; and EPS forecasts are way off.
September 17 2019
Momentum Menaced...
By some definitions, last week was the worst week in a decade for quantitative momentum strategies, which bet that recent winners will keep on winning: Monday 9 September saw the biggest single day move in Barra US Momentum raw returns since 2007 (Figure 1). By our calculations, this represented an eight standard deviation move for US momentum.
Much of the blame for the unwind has been placed on the bond market. Before last week, as fast as stocks had risen, so had bonds, with US 10-year yields below 1.5% at the end of August in the strongest rally for Treasuries since 2008. However, concerns about increasing imbalances and decreasing benefits of continued expansionary monetary policy, and alleviation of the trade tensions with signs of mutual concessions from both US and China, rattled markets as Treasury rates reversed course, jumping faster than any time since Donald Trump was elected president.
We ran an analysis to identify big momentum breaks for US and European momentum, which showed that over 15 years’ of data, the vast majority of these momentum breaks occurred during the sub-prime crisis, which makes for an odd sample. However, there is little consistency about how the momentum factor behaves subsequently: the range of outcomes is wide; the hit rates do not improve materially with time; and in some instances, factor performance that recovers goes on to decline beyond the initial trigger, i.e. this doesn’t look like high-conviction capitulation.
Figure 1. Momentum Unwinds in Context
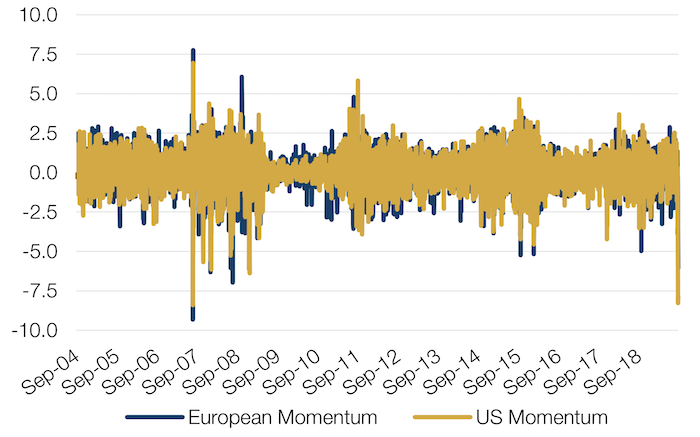
Source: Man Group database; as of 10 September 2019.
Still, despite no obvious consistent recovery in momentum, our analysis did show that momentum breaks tend to stabilise quite quickly – i.e. they are short and sharp.
...While Value Strikes Back
In Europe specifically, while it is too early to call a definitive rotation in the equity markets, we see tentative signs of inflection in style leadership.
As the unwind in the markets happened, Growth and Momentum dramatically underperformed Value – in a short period of time, with high volumes, in a partial unwind of a multi-year trend – with sector leadership moving accordingly. The fact that this dynamic persisted after the European Central Bank’s decision to persevere with the monetary stimulus is being regarded by some as confirmatory. And more recently, the spike in the oil price – a key input in the vast majority of supply chains – if persistent over time, has the potential, in our view, to become the much awaited catalyst for inflation to return to the system, finally allowing for an inflection in the multi- decade long trend of falling yields.
Problems loading this infographic? - Please click here
Source: Bloomberg; as of 13 September 2019.
Problems loading this infographic? - Please click here
Do You Bite Your Thumb At Us, Sir?
Under a 25-year deal reportedly sealed in August, China will buy – in renminbi – oil, gas and petrochemical products at discounted prices from Iran. In return, China will invest USD280 billion in Iran’s oil, gas, and petrochemical sectors that are being affected by US sanctions. In addition, Beijing will deploy up to 5,000 Chinese security personnel on the ground in Iran, as well as protecting shipments of Iranian oil from the Persian Gulf to China.
We believe this is an important development in the China- US trade tensions, and one that increases the risk of the trade war escalating – despite the recent thaw in relations.
First, this agreement allows China to bypass the US dollar-denominated international financial system. Second, the US will likely see this as a way of China thumbing her nose at the US: with the US imposing unilateral sanctions on Iran, China is, in effect, allowing Iran to ‘survive’ by investing in the country, letting it secure a market for its oil and gas, and protecting it against any military strikes.
Levitation in EPS Growth Forecasts
Earnings-per-share growth forecasts for US equities for 2020 have remained unchanged, despite 2019 forecasts being significantly cut (Figure 4). In our view, this divergence is too large; something has to give.
With the US/China trade war having weighed on analysts’ 2019 estimates, we believe these buoyant 2020 EPS growth estimates imply two things: first, that analysts are pricing in an end to the trade war during 2019; and secondly, uncertainty has made analysts reluctant to adjust 2020 growth estimates.
If the latter, we would expect third-quarter earnings reporting in October and November 2019 to precipitate significant adjustments to the 2020 estimates, with knock-on effects for US equity markets.
Figure 4. Sell-Side Analyst EPS Growth Estimates
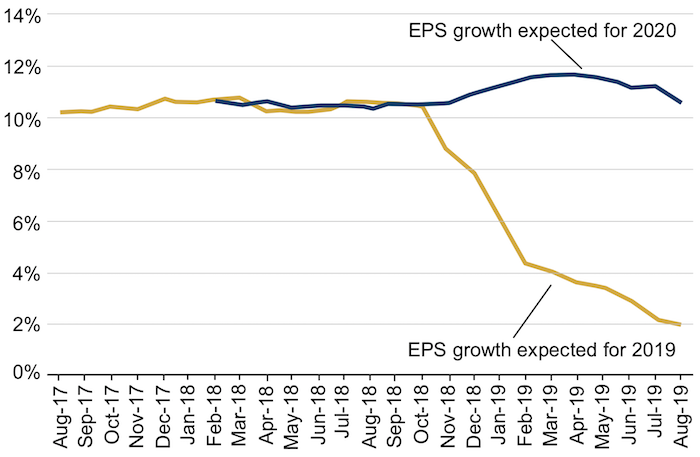
Source: Datastream, Bernstein; as of 9 September 2019.
With contribution from: Ed Cole (Man GLG, Managing Director), Didier Darricau (Man GLG, Quant Analyst), Firmino Morgado (Man GLG, Portfolio Manager), Filipe Bergana (Man GLG, Portfolio Manager), Albana Costa Loba (Man GLG, Analyst), Pierre-Henri Flamand (Man GLG, Special Adviser) and Dan Taylor (Man Numeric, co-CIO).
You are now exiting our website
Please be aware that you are now exiting the Man Institute | Man Group website. Links to our social media pages are provided only as a reference and courtesy to our users. Man Institute | Man Group has no control over such pages, does not recommend or endorse any opinions or non-Man Institute | Man Group related information or content of such sites and makes no warranties as to their content. Man Institute | Man Group assumes no liability for non Man Institute | Man Group related information contained in social media pages. Please note that the social media sites may have different terms of use, privacy and/or security policy from Man Institute | Man Group.