Mood swings and sensitivity: participants from across Man Group’s trading floor assess the economic cycle; and analysing equity factors against bond yields.
Mood swings and sensitivity: participants from across Man Group’s trading floor assess the economic cycle; and analysing equity factors against bond yields.
October 22 2019
Mood Swings
In the past week, we conducted a floor-wide survey of where we are in the cycle using David M. Darst’s legendary schematic. As a reminder, participants are asked to identify where we are in the cycle overall, as well as their view on the positioning of Fundamentals, Valuation and Psychology. We show the results in Figure 1, along with those of the same exercise six months ago (which we previously wrote about here). Back then, the conclusion was there was still gas in the tank, and so it has transpired with MSCI World returning 6% (albeit emerging markets is flat) in that time.
Now, the reading feels much more bearish. Six months ago, 40% of respondents thought we were in either peak or bear market territory. Today, that has risen to 80%. There has been a significant rise in the proportion assessing Fundamentals and Valuation to be in bear territory, the former rising from 25% to 46%, the latter from 0% to 28%. The Fundamentals move is unsurprising, especially given the shredding of survey data. In a world where the ISM has fallen from 57 to 48 and the Ifo expectations from 94 to 91, this was never going to be a pretty result. The move in Valuation is more unexpected given that, at the headline level, multiples are fairly level. MSCI ACWI, for example, is barely up over the last six months on 15x price-to-earnings. Our guess would be that idiosyncratic valuation headlines, of which an office sharing app is the most recent example, are taking their toll.
Another thing worth noting is the bifurcation in Psychology. In the schematics, we circle any of the sub-components that were opted for by at least 20% of respondents. In March, we can see that Psychology was fairly even across the three central zones. Since then, it has become split between green shoots and impending Armageddon. Qualitatively, we would explain this as the crystallisation of investor sentiment mood swings. These are more pronounced at the peak of the cycle due to increased frequency of debate around whether the famine has begun, or whether there are still months, or indeed years, of plenty to come.
Figure 1. Where Are We in the Cycle? – October 2019
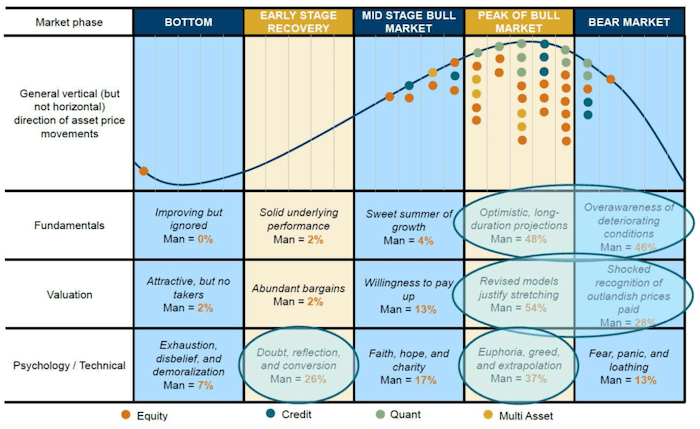
Source: Man Solutions
Inspired by David M. Darst at Morgan Stanley Private Wealth Management Asset Allocation Group.
Figure 2. Where Are We in the Cycle? – March 2019
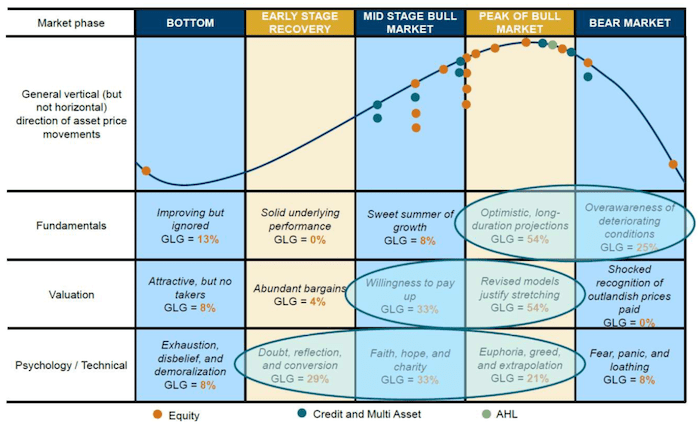
Source: Man Solutions
Inspired by David M. Darst at Morgan Stanley Private Wealth Management Asset Allocation Group.
The Bond-Return Sensitivity of Equity Factors: A Tighter Connection
Rolling 36-month regressions show a tighter connection in the recent past between US 10-year bond returns and global equity factor returns.
Explanatory regressions cannot assign causality; it may be that Value and Momentum factors are driven by rate moves, or it may be that factor returns and rate moves reflect an underlying macro principal component.
In reconciling conflicting expectations with observed betas, we make two observations: First, levered names have to roll their debt, which should lead them to have a positive bond-return beta. Alternatively, they can be thought of as short holders of debt instruments, which should lead them to have a negative bond-return beta. Secondly, shorter duration of value (compared to growth) stocks leads to a negative bond-return beta expectation. For dividend yield, this is countered by the empirical observation that investors treat dividend-paying stocks as bond-substitutes.
Problems loading this infographic? - Please click here
Source: Man Numeric, Barra GEMLT, Bloomberg; Between January 2003 and September 2019.
Problems loading this infographic? - Please click here
Source: Man Numeric, Barra GEMLT, Bloomberg; Between January 2003 and September 2019.
With contribution from: Henry Neville (Man Solutions, Analyst), Ben Funnell (Man Solutions, Portfolio Manager), Teun Draaisma (Man Solutions, Portfolio Manager) and Jayendran Rajamony (Man Numeric, Head of Alternatives).
You are now exiting our website
Please be aware that you are now exiting the Man Institute | Man Group website. Links to our social media pages are provided only as a reference and courtesy to our users. Man Institute | Man Group has no control over such pages, does not recommend or endorse any opinions or non-Man Institute | Man Group related information or content of such sites and makes no warranties as to their content. Man Institute | Man Group assumes no liability for non Man Institute | Man Group related information contained in social media pages. Please note that the social media sites may have different terms of use, privacy and/or security policy from Man Institute | Man Group.