In this week's edition: why we believe the US dollar could weaken; and 19 years after the dot-com bubble burst, are we in a similar tech environment?
In this week's edition: why we believe the US dollar could weaken; and 19 years after the dot-com bubble burst, are we in a similar tech environment?
May 7 2019

When Growth Zigs, the Dollar Zags
The dollar has historically been a counter-cyclical currency: as global growth has accelerated, the dollar has weakened, and as it ebbed, the dollar has strengthened. Figure 1 demonstrates the negative correlation between the US dollar and the global manufacturing PMI.
This pattern now bodes ill for dollar bulls, in our view. Some of our leading indicators, including the
China credit impulse and the Man Group Lead Economic Indicator for the ISM, suggest that growth will improve on a 6-9 month view. One could even argue that the two engines of global growth – the US and China – have already grown faster than expected: US GDP surged by 3.2% in the first quarter of 2019, the best quarter for the US economy since 2015, despite a five-week government slowdown from December to January. China grew by 6.4% in the quarter, compared with expectations of 6.3% as government stimulus measures took hold.
The dollar has been strengthening since early 2018. As global growth starts to accelerate, the next six months could conceivably reverse that trend, in our view.
Figure 1: Annual % Change in US Dollar Versus Global Manufacturing PMI
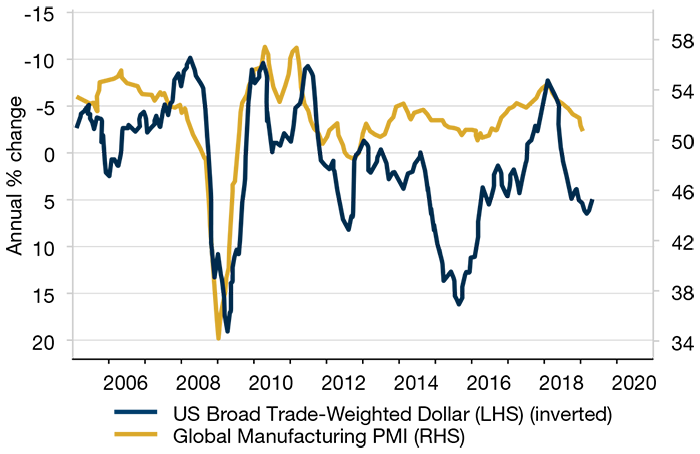
Source: BCA Research; As of April 26, 2019.
Unicorns Dance as Music Keeps Playing
Nineteen years after the dot-com bubble burst, are we in a similar tech environment?
While we do not believe there is a bubble in the listed tech sector overall, we do believe there are some pretty frothy valuations in private companies that are coming to market. Indeed, there have been a slew of highly-valued startups – with strong user growth, but billion-dollar losses – pursuing a stock market listing.
As long as investors are willing to accept user growth, rather than traditional metrics, as a proxy for future profitability, the music could keep on playing especially in a low cost of capital environment. However, our view is that it may only be a matter of time before it is proven that a lot of these unicorns are nothing but mythical beasts.
MSCI EM: Concentration Risk
The MSCI EM Index has become concentrated due to the growth of Chinese internet companies: the top 10 stocks now comprise about a quarter of the MSCI EM Index (Figure 2), above the 21% for the top 10 companies in the S&P 500 Index.
Unsurprisingly, then, the top 10 index weight’s average Barra Value exposure has turned negative (i.e. more expensive, Figure 3), while the volatility exposure has picked up (i.e. more risky, Figure 4). This concentration of the top 10 names and the shift in their factor exposures pose challenges for active managers, in our view.
Figure 2: Top 10 Weights – MSCI EM Versus S&P500
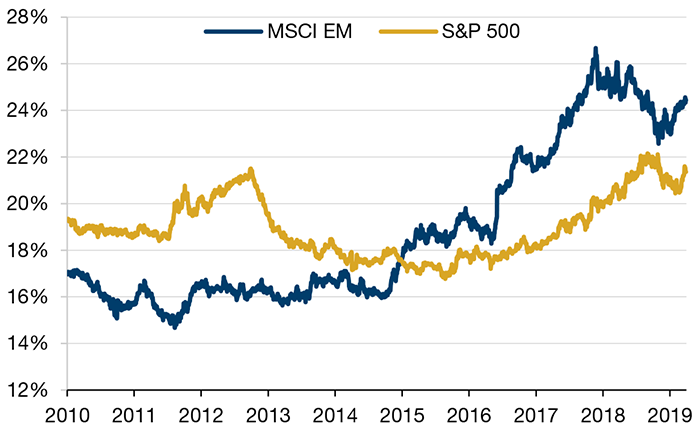
Source: MSCI, S&P; As of 31 March, 2019.
Figure 3: Barra Value Exposure
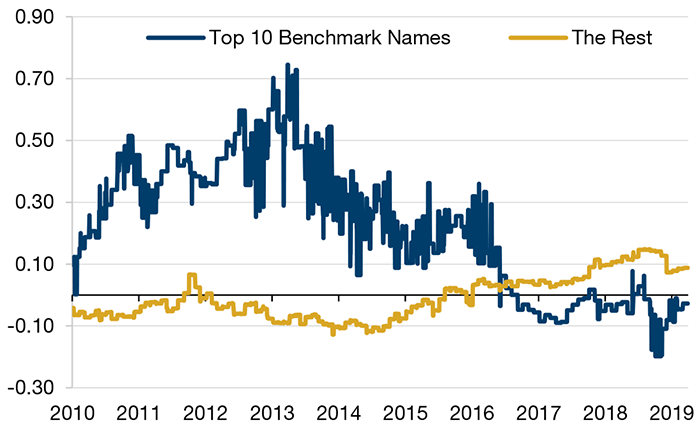
Source: MSCI; As of 31 March, 2019.
Figure 4: Barra Volatility Exposure
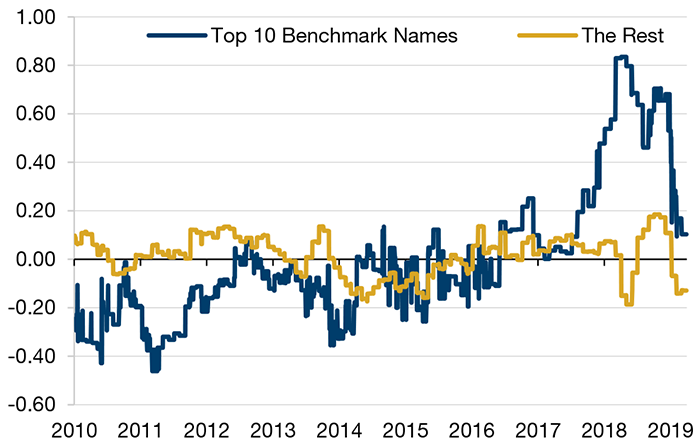
Source: MSCI; As of 31 March, 2019.
With contribution from: Teun Draaisma (Man Solutions, Portfolio Manager), Priyan Kodeeswaran (Man GLG, Portfolio Manager), Rob Furdak (Man Numeric, co-CIO) and Ziang Fang (Man Numeric, Senior Portfolio Analyst).
You are now exiting our website
Please be aware that you are now exiting the Man Institute | Man Group website. Links to our social media pages are provided only as a reference and courtesy to our users. Man Institute | Man Group has no control over such pages, does not recommend or endorse any opinions or non-Man Institute | Man Group related information or content of such sites and makes no warranties as to their content. Man Institute | Man Group assumes no liability for non Man Institute | Man Group related information contained in social media pages. Please note that the social media sites may have different terms of use, privacy and/or security policy from Man Institute | Man Group.