In this week's edition: why we believe markets are failing to assess the potential for volatility during Brexit; and are green shoots appearing in the US?
In this week's edition: why we believe markets are failing to assess the potential for volatility during Brexit; and are green shoots appearing in the US?
March 12 2019
UK Volatility: Cheap, In Spite of Everything?
With just more than two weeks to go before the UK is due to leave the EU, one could be forgiven for assuming that hedging against volatility in UK equities might be expensive. At the time of writing, Parliament is yet to consent to the Withdrawal Agreement, and there seems to be no clear consensus around any one political option to break the deadlock.
Against that backdrop, surprisingly, UK volatility is selling cheap, in our view. Implied volatility, as measured by the cost of options to hedge the FTSE 100 Index, is less than historical realised volatility (Figure 1). In other words, UK volatility options are trading at a discount to the actual volatility of the index.
While we acknowledge that it is impossible to predict the progress of negotiations with any certainty, we believe market participants are failing to accurately assess the potential for volatility during Brexit.
Figure 1: UK Implied Volatility Versus Historical Realised Volatility
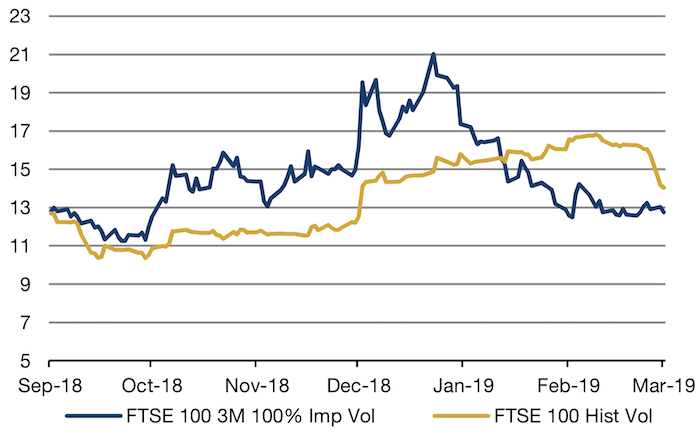
Source: As of 5 March, 2019
Green Shoots in US
A US recession is still on hold, and indeed, positive economic performance may be around the corner, in our view.
Our US Leading Indicator model, which leads the Institute for Supply Management (‘ISM’) by nine months, had been suggesting a falling US Purchasing Managers Index (‘PMI’) since early 2017. Interestingly, we see an additional lag developing from 2016 onwards, potentially coinciding with the widening of the fiscal deficit.
Whatever the cause, the fall in the actual PMI since August 2018 suggests to us that the model continues to have validity. The indicator takes a variety of metrics designed to reflect companies’ cost of component parts, cost of capital and the major consumer trends. Of these three, it has been component costs which have been most substantially contributing to the stabilisation. This suggests to us that despite trade tensions, the muted inflation we have seen since mid-2018 – year-on-year PPI is down 140 basis points to 2% since July 2018 – is making trading conditions more benevolent.
The indicator suggests that the PMI could bottom at around 49. The model suggests this could happen by the end of May this year, but given the additional lag we have discussed, we think the timing is maybe later 2019/early 2020. Crucially, the bottom that is suggested is above the 45 level that has historically been associated with recession. This old cycle may have life in it yet.
Figure 2: US Leading Indicator Model
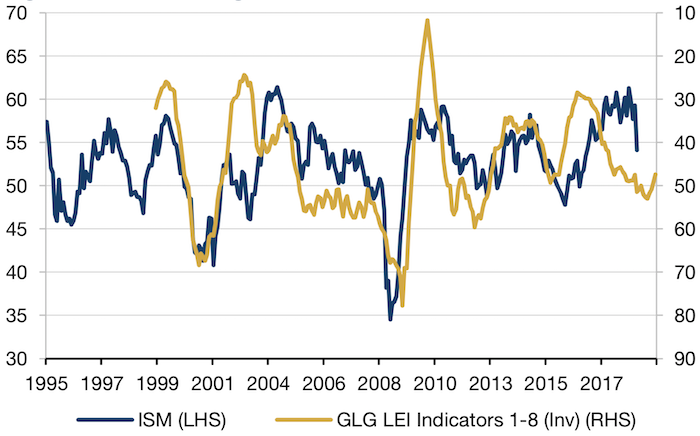
Source: Man GLG, Bloomberg, as of February 2019
Could Treasuries Upset the Apple Cart?
We have had a slew of mostly weaker data come out of the US in the past few weeks: home resales plunged to a more than a 3-year low in January; the Philadelphia Fed manufacturing activity index dropped to a reading of -4.1 in February, the first negative reading since May 2016; and December retail sales and manufacturing output in January both declined steeply. 1
What’s interesting is that even with the weaker data, Treasuries have been incapable of rallying, despite a record net long position in 10-year Treasuries among asset managers.2 As such, we believe that there is a material risk of Treasuries selling off and upsetting risk assets should we start to see positive data.
Disconnect Between Expectations and Reality
Since 2017, the percentage of profitable firms has either stagnated (for large caps) or fallen sharply (for small caps). This is despite 12-month forward earnings per share (‘EPS’) expectations trending upwards. Indeed, throughout this period, less than two-thirds of the companies in the Russell 2000 Index have been profitable, yet expectations rose. However, we started to see a pullback in expectations toward the end of 2018.
Figure 3: Percent of Profitable Firms in the Russell 1000 Index
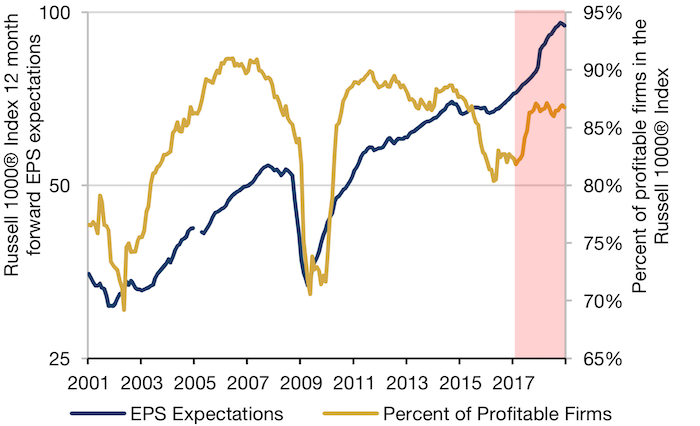
Figure 4: Percent of Profitable Firms in the Russell 2000 Index
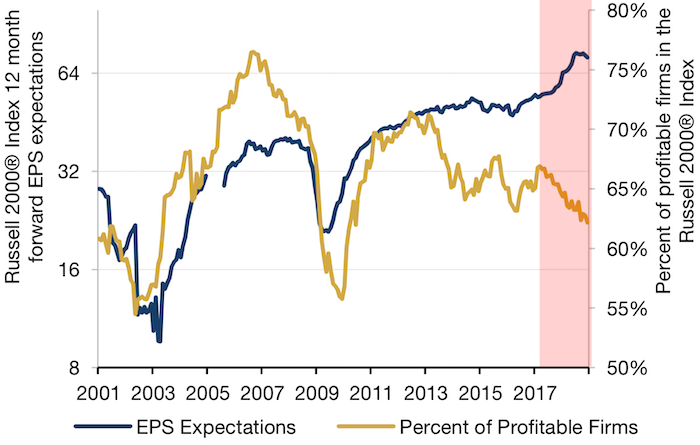
Source: Bloomberg defines Index level EPS as (Estimated EPS for each equity * number of shares in index * FX rate) / (Index divisor * Coverage factor). Using the blended numbers, is the weighted average of FY1 and FY2. That is, [((number of days until next fiscal year/trading days in year) * FY1 + (1 –(number of days until next fiscal year/trading days in year)) * FY1]
With contribution from: Teun Draaisma (Man Solutions, Portfolio Manager), Ben Funnell (Man Solutions, Portfolio Manager), Henry Neville (Man Solutions, Analyst), Edward Cole (Man GLG, Managing Director), Rob Furdak (Man Numeric, co-CIO) and Tyler Hayes (Man Numeric, Portfolio Manager).
1. Source: Bloomberg
2. Source: Bloomberg; as of 19 February 2019
You are now exiting our website
Please be aware that you are now exiting the Man Institute | Man Group website. Links to our social media pages are provided only as a reference and courtesy to our users. Man Institute | Man Group has no control over such pages, does not recommend or endorse any opinions or non-Man Institute | Man Group related information or content of such sites and makes no warranties as to their content. Man Institute | Man Group assumes no liability for non Man Institute | Man Group related information contained in social media pages. Please note that the social media sites may have different terms of use, privacy and/or security policy from Man Institute | Man Group.