Why we believe sterling volatility looks cheap; and what will crowd out demand for substitute assets, EM included?
Why we believe sterling volatility looks cheap; and what will crowd out demand for substitute assets, EM included?
June 25 2019
Three Spoiled Ballot Papers: Why Sterling Volatility is Cheap
In the fourth round of voting in the UK Conservative Party leadership contest on 20 June, two members of Parliament (‘MPs’) spoiled their ballots papers.1 There was a further spoiled ballot in the fifth and final round. Initially, this might seem to be inconsequential. Three hundred and thirteen Conservative (‘Tory’) MPs voted – why should we care that 0.64% of the parliamentary party did not vote?
The answer is that this suggests at least two Tory MPs might not support any of the remaining candidates for party leadership, which, in turn, does not bode well for a confidence vote. It is highly likely, in our view, that the incoming Prime Minister will face an immediate confidence vote. After a recall petition forced a by-election in a current Tory seat2, the government now has 312 sitting MPs, with support from 10 DUP MPs under a confidence and supply arrangement.
With 641 sitting MPs3, the government can call on only 322 votes. Assuming strict party discipline, if any Tory MPs voted with opposition, this would be enough to bring down the government. Whilst this doesn’t factor in abstentions or opposition MPs voting against the whip, it illustrates that the government no longer has a margin for error.
In this context, we believe sterling volatility looks cheap, given previous currency swings. As of 20 June, GBP/USD was at 1.27, with a 6-month straddle at 5.3%. This gives a range of 1.34 on the upside, which we feel is feasible if Boris Johnson avoids exiting the EU on 31 October as some commentators suspect. The downside of 1.20 again feels very possible in either a hard Brexit scenario, or a Corbyn win in a general election.
The Deluge: Treasury Deposits and Liquidity
The monetary expansionary effect of the USD213 billion drop in the US Treasury’s cash cushion (declining from USD400 billion at the beginning of May to USD188 billion to June 12)4 was equivalent to an annualised quantitative easing of USD1.8trillion. This is very close to the levels experienced at the peak of QE in 2017 and impacted the US yield curve accordingly (on the short end, by the injection of liquidity, and in the long end, by the lower issuance of US Treasury debt).
This impact should reverse once a new debt ceiling is negotiated and the Treasury is able to resume its borrowing plans.5 In light of the pace that the Treasury is spending its cash cushion, we anticipate that such an agreement needs to be reached before the end of summer. This will work as concentrated quantitative tightening on a short period of time, as the Federal Reserve will have to, in our view, replenish its cash base and fund its larger deficit. The impact in the yield curve and risk assets is likely to be exacerbated by the current long positioning and tight valuations across the board.
Transversal to the US Treasury cash cushion changes, a larger US deficit will lead the net new supply of Treasury debt to increase from USD500 billion annually until 2017 to roughly USD1.1 trillion from 2018 on. This is equivalent to a cUSD600 billion increase in annual US Treasury bonds supply that will, we believe, accumulate annually over the years and will crowd out demand for substitute assets, emerging markets included. For more, read: Is the DM Rates Rally Due a Reversal?
Figure 1: Treasury Deposits at the Fed and Treasury Yields
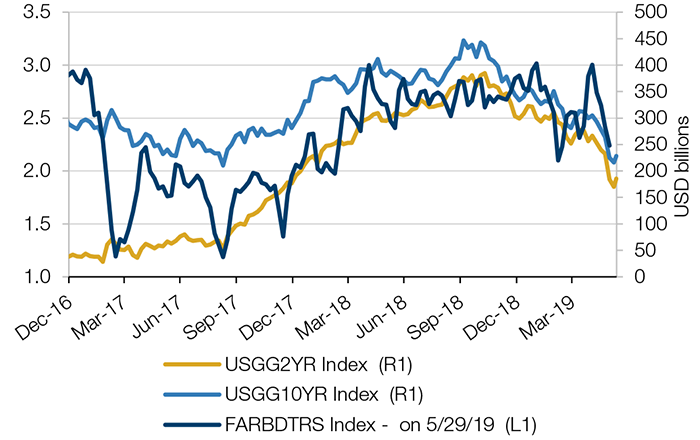
As of 11 June, 2019.
US Manufacturing Recession?
The New York Fed’s Empire State manufacturing index plunged a record 26.4 points in June to -8.6, driven by uncertainty caused by tough US trade policy against China and Mexico. The index fell into negative territory for the first time in more than two years.
The decline does not bode well for the ISM Manufacturing index (Figure 2) or the industrial production index (Figure 3), both of which have historically followed the Empire State manufacturing index. The large pullback might also bolster the case for an interest-rate cut.
Figure 2: Empire State Manufacturing Survey and ISM Manufacturing
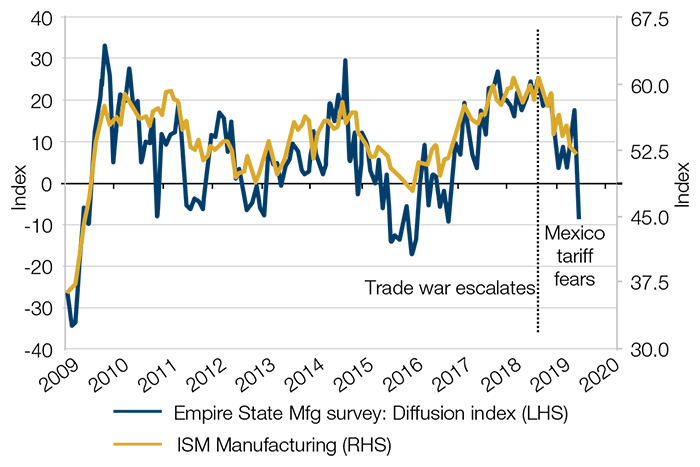
Source: Deutsche Bank Research; As of June 2019.
Figure 3: Empire State Manufacturing Survey and Manufacturing Output
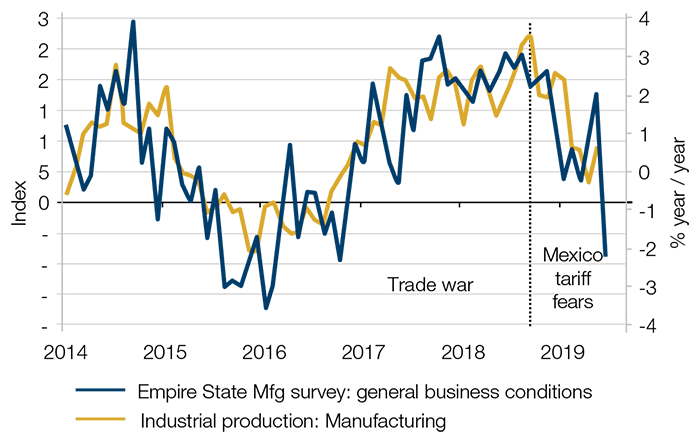
Source: Deutsche Bank Research; As of June 2019.
With contribution from: Ben Funnell (Man Solutions, Portfolio Manager), Teun Draaisma (Man Solutions, Portfolio Manager), Henry Neville (Man Solutions, Analyst) Guillermo Osses (Man GLG, Portfolio Manager) and Dan Taylor (Man Numeric, co-CIO).
2. https://news.sky.com/story/convicted-tory-mp-chris-davies-loses-seat-triggering-by-election-11746258
3. This total excludes the Speaker, the abstentionist party Sinn Fein and the vacant seat of Brecon and Radnorshire.
4. FARBDTRS Index: US Factors Absorbing Reserve Funds Treasury General Account Deposits. Source: Federal Reserve.
5. The debt ceiling limit was reinstated on March 2 after being suspended by a year. So far, the Treasury Department has been shifting funds and taking other extraordinary measures to prevent a default on the government’s debt. Without an increase or suspension of the current debt ceiling, the U.S. would be heading for a default by late summer (according to the US Treasury secretary) or by end 2019 (according to the view of Congressional Budget Office). The government is in talks with Congress on raising the debt ceiling and lifting spending caps.
You are now exiting our website
Please be aware that you are now exiting the Man Institute | Man Group website. Links to our social media pages are provided only as a reference and courtesy to our users. Man Institute | Man Group has no control over such pages, does not recommend or endorse any opinions or non-Man Institute | Man Group related information or content of such sites and makes no warranties as to their content. Man Institute | Man Group assumes no liability for non Man Institute | Man Group related information contained in social media pages. Please note that the social media sites may have different terms of use, privacy and/or security policy from Man Institute | Man Group.