While we don’t think there is a risk of an immediate US recession, some factors could be signalling trouble ahead.
While we don’t think there is a risk of an immediate US recession, some factors could be signalling trouble ahead.
June 11 2019
Thinking About a US Recession...
Since the fourth quarter of 2018, we had been of the view that a US recession was not imminent. General consensus across Man Group was that none of the ‘normal’ recessionary signals were flashing. Even when the yield on 10-year US Treasuries dipped below that of 3-month Treasuries in December and again in March, we did not believe that there was an immediate cyclical signal.
However, the tone changed with the Federal Open Market Committee press conference of 1 May, when Federal Reserve Chair Jerome Powell suggested that soft inflation data would likely be transient. For a market already pricing 25 basis points of policy rate cuts in 2019, this proved a little disconcerting, and prompted a short-lived repricing of policy rate expectations. On 7 May, ahead of a planned US visit by the largest-ever Chinese delegation, President Donald Trump reignited the trade war. Macro data that followed – but which crucially do not yet reflect the impact of renewed Sino-US tensions – showed weak industrial production and retail sales in both the US and China, and weak PMIs from Europe (particularly Germany, where the manufacturing PMI has been sub-50 since February). A little over a month on from the FOMC press conference, January 2020 Fed Funds futures have priced another 55 basis points in policy rate cuts.
So, not only has there been a repricing of rate expectations, but there are also three other signals that we are now keeping an eye on as a signal of a potential US recession.
The first signal we are looking at is the spread between the 5-year Treasury note yield and the 3-month Treasury bill yield. The ability of the yield curve to predict recession was first documented by Professor Campbell R. Harvey, Man Group’s investment strategy adviser. His analysis shows that the yield curve projections of a recession’s probability hit more than 80% in the 1970s and 1980s, then settled into the 40%-50% range for the last three recessions. As of 4 June, the yield curve implied about a 40% probability of a recession (Figure 1).
Secondly, as of the fourth quarter of 2018, the output gap is running ahead of potential. (The output gap is the percentage difference between actual output and what the nonpartisan Congressional Budget Office estimates the economy could produce if it were operating at capacity, with all able workers and capital fully engaged.
A negative number means the economy isn’t meeting its full potential, while a positive number means it’s going too fast.) This typically precedes a contraction in margins, which feeds into unemployment (Figure 2).
Third, and as a corollary of the previous point, we are closely watching unemployment, which typically turns upwards before a recession. At present, it remains close to a record low. But in the context of these other data, incoming data are taking on particular importance.
Ultimately, while we still do not think there is a risk of an immediate recession, we are now looking at a cyclical data that is some way from the recovery we anticipated at the start of the year, a trade war whose disruption is hard to quantify and a yield-curve inversion that could be signalling trouble ahead.
Figure 1: Harvey Yield Curve Recession Probabilities: 12 Months
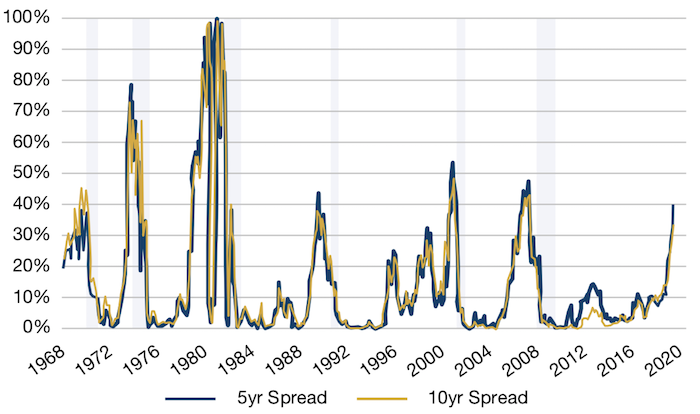
Source: St. Louis Fed; as of 4 June, 2019.
Problems loading this infographic? - Please click here
As of 31 March, 2019.
...As Current Expansion Becomes Longest on Record
The context of our views of a US recession should be taken against the background of the length of the US economic expansion, which, in July, will become the longest on record at 121 months.
Figure 3: Length of US Economic Expansions
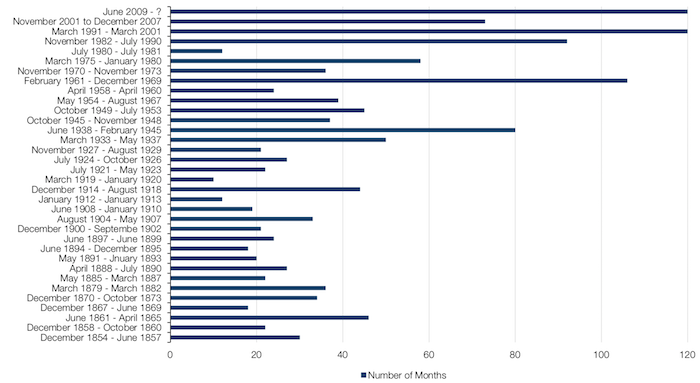
Source: NBER. The expansion from June 2009 is 120 months, and counting.
With contribution from: Ed Cole (Man GLG, Managing Director) and Professor Campbell R. Harvey (Man Group, Academic Adviser).
You are now exiting our website
Please be aware that you are now exiting the Man Institute | Man Group website. Links to our social media pages are provided only as a reference and courtesy to our users. Man Institute | Man Group has no control over such pages, does not recommend or endorse any opinions or non-Man Institute | Man Group related information or content of such sites and makes no warranties as to their content. Man Institute | Man Group assumes no liability for non Man Institute | Man Group related information contained in social media pages. Please note that the social media sites may have different terms of use, privacy and/or security policy from Man Institute | Man Group.