It’s no secret that Donald Trump favours a lower US dollar. But is the greenback really overvalued?
It’s no secret that Donald Trump favours a lower US dollar. But is the greenback really overvalued?
July 30 2019
US Dollar: Over the Hill?
It’s no secret that US President Donald Trump favours a lower US dollar. From tweets about how other countries ‘unfairly’ devalue their currencies against the greenback, to asking aides on how to weaken the dollar, there is a growing momentum for FX momentum.
But actions speak louder than words. So, is there anything that Trump can actually do to depreciate the US dollar?
The short answer is yes: the US government has the legal basis to intervene using the Exchange Stabilisation Fund. The fund “with the approval of the President, may deal in gold, foreign exchange and other instruments of credit and securities”. Indeed, in 1978, the fund issued bonds in FX to support the US dollar.
However, while the fund has an incredibly broad remit, it is somewhat limited in scope. About USD22 billion of US Treasuries and USD51 billion in special drawing rights can be exchanged for the US dollar. Additionally, the fund has the scope to use Federal Reserve leverage through warehousing, currently at USD5 billion, but importantly, needs Fed approval to increase the warehousing.
The more important question may be: is the US dollar really overvalued?
Figure 1 compares the dollar index (‘DXY’) with the US 2-year spread over DXY-weighted 2-year, demonstrating that rate differentials do indeed have some bearing on the DXY trend. Since the collapse of the Bretton Woods agreement in 1971, the US dollar has gone through three strengthening cycles (Figure 2). (To be fair, there are some caveats about using this indicator. It has only been 48 years since Bretton Woods collapsed, which does not allow for a particularly large data set.) The markers in Figure 2 show when the DXY has recorded a 20% deviation from its 10-year moving average. Previous cycles suggest that the US dollar may have already peaked, in which case, there could be a US dollar bear market coming in the next couple of years.
Figure 1. Rate Differentials Could Have Some Bearing on the DXY
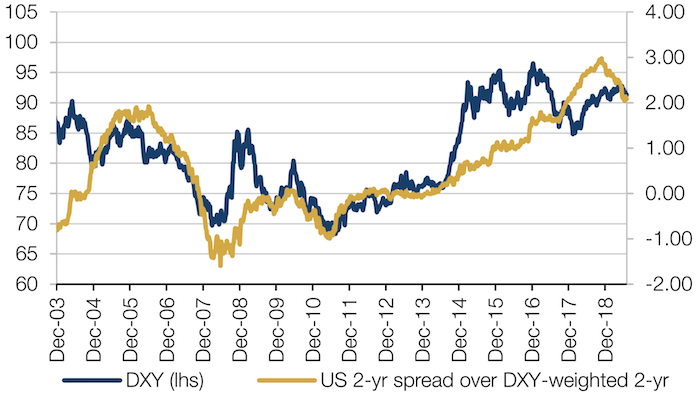
Source: Man GLG; as of 19 July 2019.
Figure 2. US Dollar Versus DXY Index
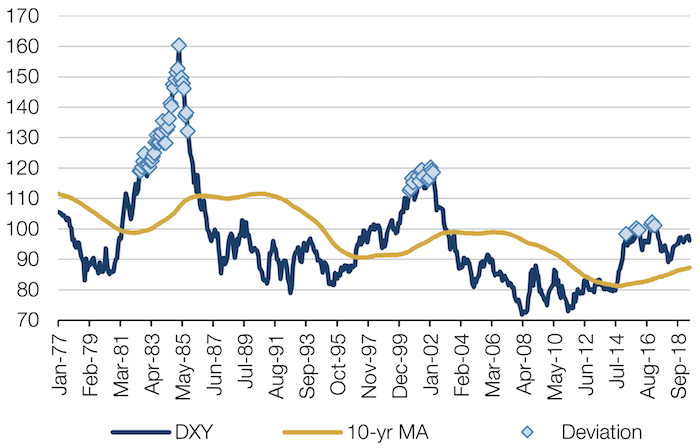
Source: Bloomberg, Man GLG; as of 28 June 2019.
Distortions in US High Yield CDX
Investors – who typically prize trading liquidity – are currently running substantial long credit positions using CDX indices, the most liquid instruments in credit (Figures 3, 4). This is despite CDX.HY trading at a 75- 125 basis points premium to fair value since early June.
Premiums (or discounts) in the indices are kept in line by arbitrageurs, who seek to normalise the difference between current and fair value by selling single-name credit default swap (‘CDS’) protection and buying index protection (i.e. selling risk). However, index arb is not closing the gap to fair value as dealers are happy to source protection on names with wide CDS spreads from the arbitrage efforts. Hence, tight names are seeing their CDS spreads getting crushed. This is a continuation of the theme where investors are avoiding risky names despite a rally in credit. This is most obviously demonstrated in the BAML high yield (‘HY’) bond index where, as of 19 July, the BB ratings cohort has returned 10.8%, single-B 9.9% and CCC 8.6%.
The net result? The distribution of spreads are out of the ordinary1:
- The current index spread is 335 bp, compared with the 3-year range of 300-475 bp. Only 11% of the 100 constituents in the index trade inside that 3-year range today;
- 200 bp is the typical spread for a ‘tight’ high yield name and 750 bp is the beginning of distressed. Only 31% of the index trades between 200 bp and 750 bp;
- More than 50% of the US HY CDX index trades tighter than 200 bp;
- Almost a quarter of the index trades inside 100 bp, or a cumulative default probability of 8% over five years. That’s almost as many as the proportion between 200 bp and 750 bp.
There is nothing to suggest that this distortion is inherently bearish. Indeed HY seems fine from a technical perspective. In our view, however, this degree of dispersion does appear to be unstable, and may exacerbate the severity of any correction.
Figure 3. CDX.HY
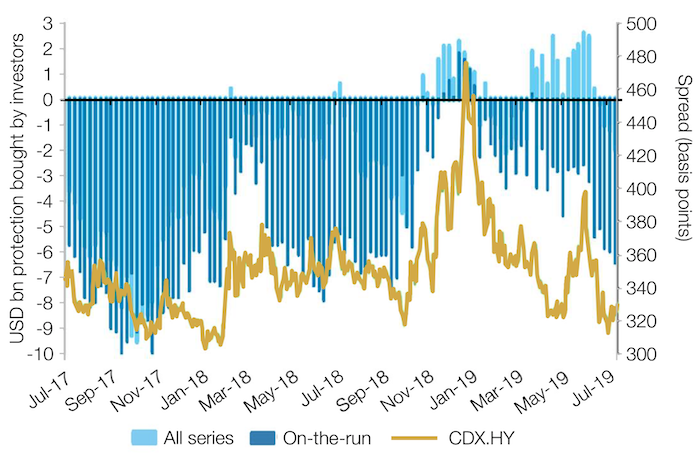
Source: DTCC, Barclays; as of 12 July.
Figure 4. CDX.IG
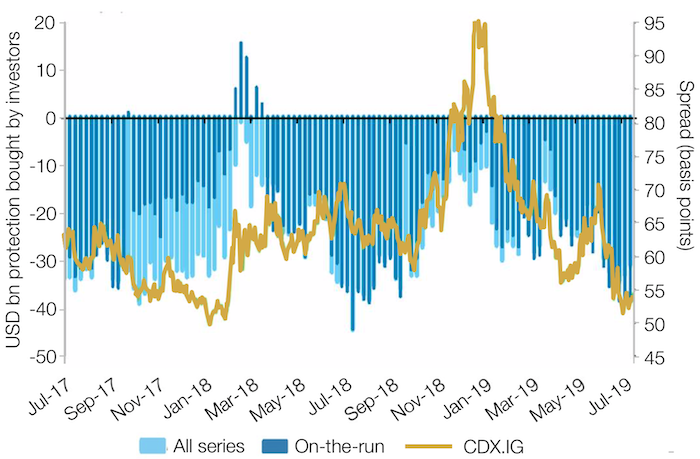
Source: DTCC, Barclays; as of 12 July.
With contribution from: Ed Cole (Man GLG, Managing Director) and Rob Alloway (Man GLG, Portfolio Manager).
1. Source: BAML HY bond index.
You are now exiting our website
Please be aware that you are now exiting the Man Institute | Man Group website. Links to our social media pages are provided only as a reference and courtesy to our users. Man Institute | Man Group has no control over such pages, does not recommend or endorse any opinions or non-Man Institute | Man Group related information or content of such sites and makes no warranties as to their content. Man Institute | Man Group assumes no liability for non Man Institute | Man Group related information contained in social media pages. Please note that the social media sites may have different terms of use, privacy and/or security policy from Man Institute | Man Group.