In this week’s edition: Is the ECB Going Japanese?; Semiconductors: Attempting to Form a Bottom; and The Value in Europe.
In this week’s edition: Is the ECB Going Japanese?; Semiconductors: Attempting to Form a Bottom; and The Value in Europe.
January 29 2019
Is the ECB Going Japanese?
In December, Mario Draghi recognised that there was a drag on banks’ profitability under the current European Central Bank Funding Scheme, where banks pay 40 basis points to deposit their current excess reserves at the central banks.
Currently as a consequence of the targeted longer-term refinancing operations (‘TLTRO’) programme, excess reserves at the ECB total about EUR1.8 trillion. A fee of 40 bp implies that banks lose about EUR7.5 billion of pre-tax profits, which we estimate to be about 10% of total profitability. While there is no country split on the excess reserves, we estimate that France, Denmark, Netherland and the Benelux account for about 75% of the ECB’s total excess reserves.
Because of this big drag of profitability of the banks, we see a real possibility that the ECB will stop punishing banks with excess liquidity, and instead move to a tiering system, such as the one used by the Bank of Japan, where:
- Existing balances can be charged a rate of 0.1%;
- A rate of 0% will be applied to the reserves that institutions are required to keep at the BoJ, and also the reserves related to its various lending support programs;
- A rate of -0.1% will be applied to any reserves not included in the first two tiers.
If this were to happen, this would be very favourable to the Nordic and northern European banks given they are very deposit rich.
Semiconductors: Attempting to Form a Bottom
Despite the semiconductor sector starting to look cheap on earnings relative to history, we believe there is more pain to come especially on estimate revisions. We would make three key points.
First, there has been overstocking this cycle (Figures 1 and 2). Companies seemed to have stockpiled components ahead of fears of a prolonged trade war hitting global supply chains. Indeed, it is important to remember that the semiconductors sector is the most cyclical sector in technology, with the least amount of forward visibility. Indeed, excessive inventory-building usually happens toward the end of the cycle for this sector.
Secondly, the overstocking has met a demand-side slowdown, which could take at least a full quarter to clear, in our view.
Third, the sector is just starting to see negative earnings revisions (Figure 3). However, encouragingly, as recently as last week, semiconductor stocks seemed to have stopped going down on poor numbers and negative forward guidance. So, while we believe there will be substantial downward revisions in the first and second quarters, we believe we have entered the beginning of the bottoming process from a share price perspective.
As earnings come down, stocks will get more expensive on an earnings basis (Figure 3). Typically, as cyclicals, you want to buy the sector when it is expensive on earnings and sell them when they are cheap on earnings. As such, as the earnings cuts come in, our view becomes more bullish. In general, for market troughs, we prefer using less earnings-biased metrics for valuation like EV/Sales and Price/Book.
Figure 1: Signs of Double Ordering Still High by Historical Standards
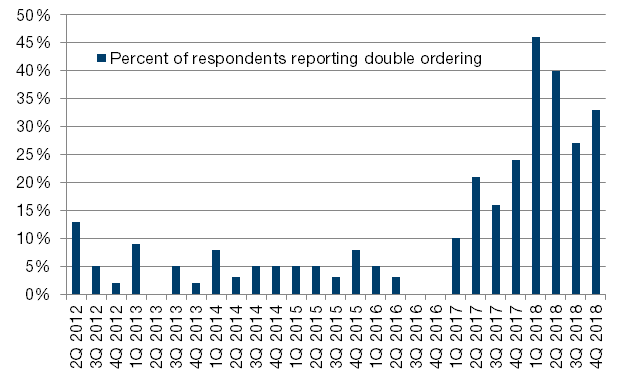
Source: Alphawise, Morgan Stanley; As of December 2018.
Figure 2: Has Recent Tariff Uncertainty Impacted Customers’ Order Trends/Inventory Management?
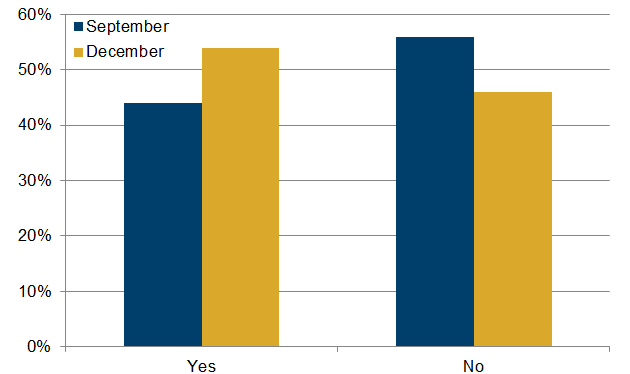
Source: Alphawise, Morgan Stanley; As of December 2018.
Figure 3: EPS, P/E Ratio for the MSCI ACWI Semiconductor Index
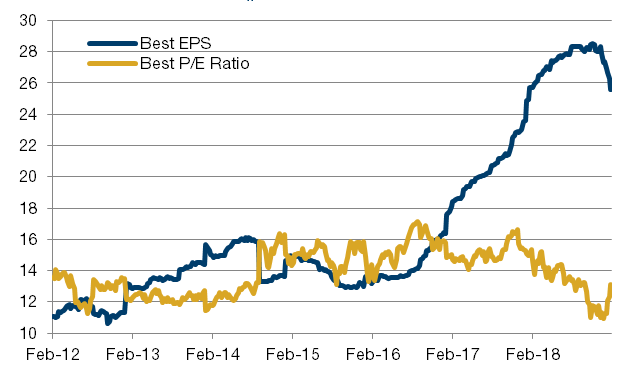
Source: Bloomberg; As of January 25, 2019.
The Value in Europe
The European yield gap over German bunds has never been bigger since the creation of the euro (Figure 4). This, combined with the fact that earnings revisions are almost as negative as they have ever been (Figure 5), suggests that it would not take a big positive catalyst to take the European market higher.
Figure 4: Gap Between Equity Cash Yield and Bond Yield in Europe Has Never Been as Wide
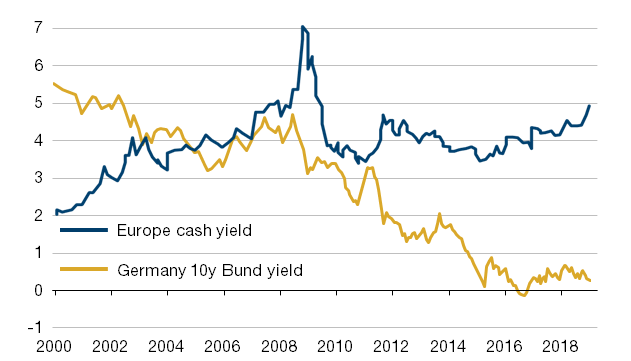
Source: Datastream, Goldman Sachs Global Investment Research, As of January 22, 2019. Note: Cash Yield = Divident yield and buyback yield.
Figure 5: Earnings Revisions Are at a 10-Year Low
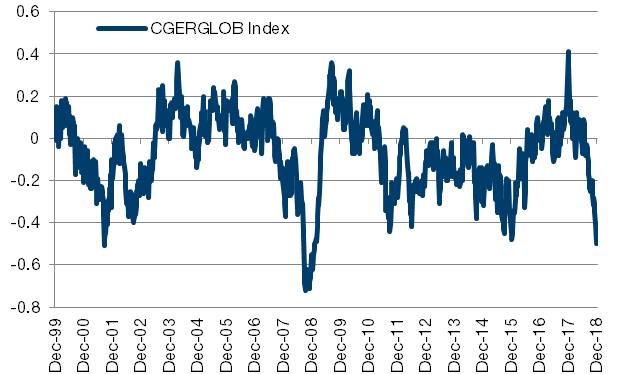
As of January 11, 2018.
With contribution from: Giovanni Baulino (Man GLG, Portfolio Manager), Priyan Kodeeswaran (Man GLG, Portfolio Manager) and Pierre-Henri Flamand (Man GLG, CIO).
You are now exiting our website
Please be aware that you are now exiting the Man Institute | Man Group website. Links to our social media pages are provided only as a reference and courtesy to our users. Man Institute | Man Group has no control over such pages, does not recommend or endorse any opinions or non-Man Institute | Man Group related information or content of such sites and makes no warranties as to their content. Man Institute | Man Group assumes no liability for non Man Institute | Man Group related information contained in social media pages. Please note that the social media sites may have different terms of use, privacy and/or security policy from Man Institute | Man Group.