In this week’s edition: Pray for Italian Growth; European Vol Is Unusually Cheap; A Word of Caution on Margins.
In this week’s edition: Pray for Italian Growth; European Vol Is Unusually Cheap; A Word of Caution on Margins.
February 5 2019

Pray for Italian Growth
What would it take for Italy to hit the buffers? In our view, not very much at all.
Whilst questions about Italy’s fiscal sustainability aren’t new, they haven’t been asked so much in recent months with Italy’s governing coalition eventually agreeing its budget with the European Commission (‘EC’) in December, and a successful primary auction earlier in January.
Indeed, we believe that Italy will also print a negative GDP number in the first quarter of 2019 (the economy shrank by 0.2% in the fourth quarter of 2018). With a stock of debt at 131% of GDP and growing, any negative growth surprises call into question the sustainability of Italy’s fiscal position but crucially may also open a new rift with the EC.
To get the December budget agreement passed, Brussels negotiated several emergency levers that should be pulled if Italy were to undershoot its agreed deficit target of 2.04% in 2019 and 2020. Of these levers, by far the most significant are VAT hikes of EUR9.4 billon and EUR13.2 billion, respectively (circa 5% on the VAT rate).
In our view, this is politically unthinkable. Lega Nord, a senior partner in the Italian governing coalition, campaigned on a flat tax rate of 20% and is committed to reducing the overall tax burden. It is also worth considering other examples of large VAT hikes: when Japan hiked its VAT rate from 5% to 8% in 2014, it immediately plunged into recession. We see no reason why Italy would be any different, with recession immediately increasing the yield on BTPs as Italy’s credit position deteriorated. We’ve previously discussed what consequences this might have for the solvency of Italian banks and insurers.
The prospect of implementing a policy contrary to Lega Nord’s manifesto, and damaging to Italy’s short-term growth, again raises the spectre of continued conflict between Italy and the EU. We would conclude that any signs of slowing Italian growth should be a major concern.
In our view, Italy remains Europe’s most pressing existential issue.
European Vol Is Unusually Cheap
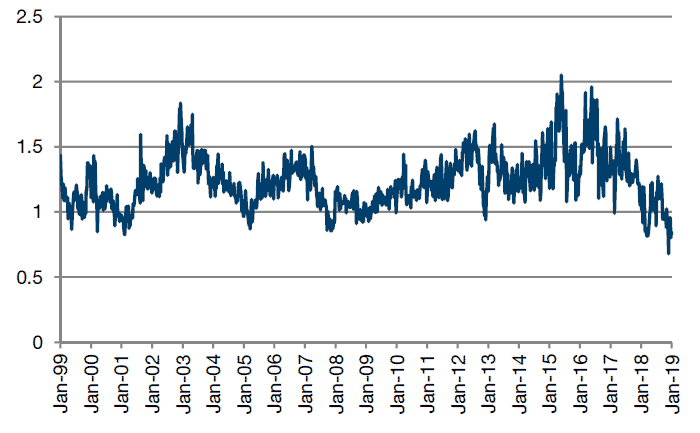
European implied volatilities are unusually cheap to volatility in the US. Specifically, as measured by the V2X, Euro Stoxx 50 implied volatilities are the near the lowest levels of the last 20 years when compared with the S&P 500 Index and the Cboe Volatility Index (‘VIX’).
The relationship, on the surface, is somewhat surprising given the more robust economic data and corporate earnings growth in the US versus Europe. It is also a sharp reversal from sovereign risk episodes between 2011 and 2016 (Greece, Italy, Brexit). However, recent realized volatility in the US (especially in December) has been very high in our view.
If one were to consider the differing risk factors, the one that stands out most may well be that the US Federal Reserve has been the most aggressive in withdrawing liquidity over the last year. Thus, when viewed through that prism, higher US volatility is not surprising. Recent dovish comments from the Fed may return this relationship to more normal levels.
In the meantime, so long as the US remains the driver of global volatility, it will continue to be challenging to manage equity risk. When thinking about hedging or directional opportunities, European index and single-stock options are presently the cheapest globally, offering potentially compelling opportunities with a large number of catalysts ahead and economic data points that seem quite weak.
Figure 1: European Implied Volatility Is Unusually Cheap to US (V2X/VIX Ratio)

As of 29 January 2019.
A Word of Caution on Margins
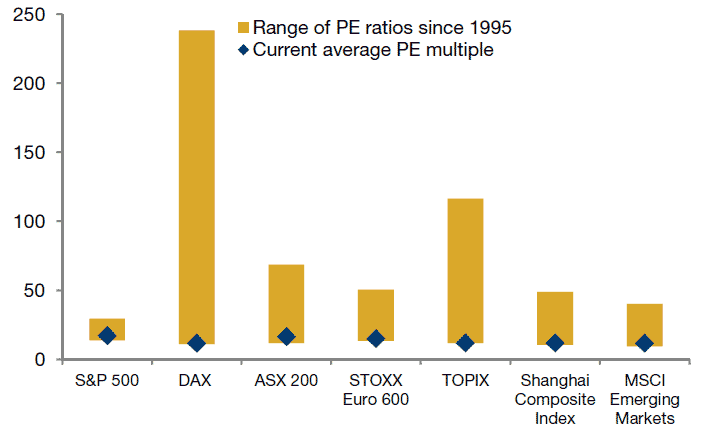
Equities are looking cheap everywhere. Indeed, versus long-term ranges, PE ratios are languishing at the bottom.
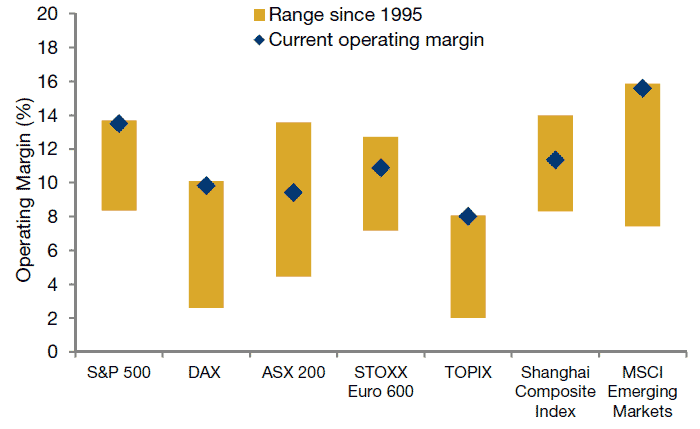
However, this is supported by peak margins in the US, Germany, Japan and emerging markets (‘EM’), with EM operating-profit margins higher than the US.
The one market that stands out as being cheap, with margins off peak levels, is China.
Figure 2: Equities’ PE Ratio Range Since 1995

As of 31 December 2018.
Figure 3: Equities’ Operating-Profit Margin Range Since 1995

As of 31 December 2018.
Earnings Expectations Are Falling Faster for Expensive Stocks
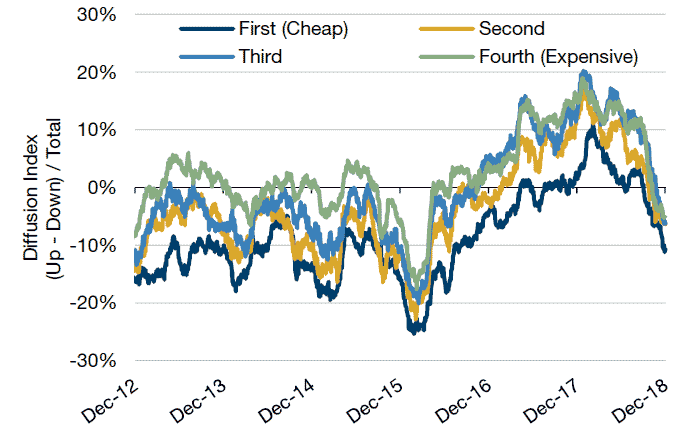
All global stocks are currently experiencing more negative earnings estimates revisions than positive revisions from the sell-side (diffusion index below the zero line in Figure 4). However, expensive stocks (the green line) are receiving the most net negative revisions, i.e. sell-side analysts are becoming more pessimistic about the expensive stocks than those that have cheap valuations. This is in contrast to the normal relationship where cheap stocks experience more negative revisions.
Figure 4: Earnings Expectations Are Falling …

Source: Man Numeric, Thomson Reuters, Global Core Universe. Note: Diffusion Index based on estimate changes for FY1 and FY2 combined. Period: December 2012 – December 2018.
Figure 5: …Faster for Expensive Stocks
|
First (Cheap) |
Second |
Third |
Fourth (Expensive) |
|
|---|---|---|---|---|
| Current Level | -11% | -6% | -6% | -5% |
| Period Average | -6% | -2% | 1% | 0% |
| 3m Change | -11% | -10% | -15% | -15% |
Source: Man Numeric, Thomson Reuters, Global Core Universe. Period: December 2012 – December 2018.
With contribution from: Chris Huggins (Man GLG, Portfolio Manager), Peter van Dooijewert (Man Solutions, Head of Institutional Hedging), Ed Cole (Man GLG, Managing Director), Rob Furdak (Man Numeric, co-CIO) and Shicong Wang (Man Numeric, Senior Portfolio Analyst).
You are now exiting our website
Please be aware that you are now exiting the Man Institute | Man Group website. Links to our social media pages are provided only as a reference and courtesy to our users. Man Institute | Man Group has no control over such pages, does not recommend or endorse any opinions or non-Man Institute | Man Group related information or content of such sites and makes no warranties as to their content. Man Institute | Man Group assumes no liability for non Man Institute | Man Group related information contained in social media pages. Please note that the social media sites may have different terms of use, privacy and/or security policy from Man Institute | Man Group.