Will there be a second UK ‘youthquake’?; how will manufacturing data affect markets?; and bifurcation in the bond market.
Will there be a second UK ‘youthquake’?; how will manufacturing data affect markets?; and bifurcation in the bond market.
December 3 2019
The Youthquake? Not Exactly 9 on the Richter Scale
One of the big stories of the 2017 UK General Election was the ‘Youthquake’, the spike in youth turnout which was perceived to have boosted the performance of the Labour party at the polls.1 The story was at the top of the agenda again last week, as the deadline to register to vote fell on 26 November. At times, it has felt that the whole country was urging each other to register: anyone with a UK social media feed will know the strange feeling of being urged to vote by someone you last spoke to during Freshers Week!
Can we count on a similar Youthquake in this election?
Before we aim to answer that question, we should note that what counts as the ‘youth vote’ is sometimes contested. To combat this difficulty, we have selected 44 years as our demarcation point, as this is roughly the age that voters change allegiance to break for the Conservative party.
Figure 1 shows cumulative voter registrations for those aged 44 or younger. An incremental 1.8 million ‘younger’ voters have registered in 2019 than in 2017. Figure 2 shows the same statistic but for voters aged 45 or older – about 620,000 more voters in this bracket have registered compared with 2017.
However, it is important to remember that with the European, council and by-elections earlier in 2019, the effect of this surge may be limited; many may already be registered to vote. In the words of John Curtice, the UK’s polling guru, “This story gets journalists excited at every election and it shouldn't. We know from the 2015 and 2017 [election] that most of the people who apply online before the deadline are on the register anyway.”2 In our view, this is about right: a higher level of young voter registration is likely to favour the Labour party, but should be taken with a pinch of salt.
Problems loading this infographic? - Please click here
Source: UK Government; as of 2 December 2019.
Problems loading this infographic? - Please click here
Source: UK Government; as of 2 December 2019.
Manufacturing Data: Good News for Cyclicals and Value?
One datapoint that caught our eye over the past week was the improvement in the manufacturing orders component of the German IFO survey, which ticked up to -10 in November from -16 in October (albeit being a 3-month moving average). Historically, this has reasonably led the direction of the current assessments component by four months. Indeed, if the relationship continues and we continue to see this upturn in manufacturing activity, it could mean that Value and Cyclicals continue to outperform.
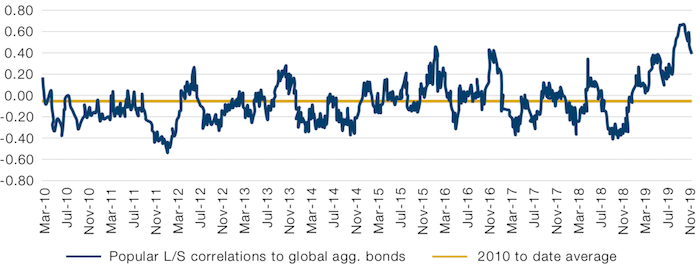
This may then be further exacerbated by current positioning. Crowding still seems to be evident in long duration assets: the Credit Suisse Prime Broker European Popular Long/Short indexes are very positively correlated to bond returns and low risk factor returns (Figures 4 and 5, respectively), and negatively correlated to value factor returns (Figure 6). In the event that we do see the manufacturing upturn, this positioning could provide fuel for a continued rotation out of long duration assets, which in equities would favour value over quality and growth.
Problems loading this infographic? - Please click here
As of 27 November 2019.
Figure 4. Credit Suisse PB Popular Long/ Short Index – Correlation to Bonds
As of 29 November 2019.
Problems loading this infographic? - Please click here
As of 29 November 2019.
Problems loading this infographic? - Please click here
As of 29 November 2019.
Yes to Quality, No to Junk
In US corporate, European high yield (‘HY’) and in emerging credit markets, there has been an interesting recent bifurcation in the demand for various buckets of risk. Broad credit indices have continued this year’s trend of strong positive performance and returns in recent months. However, within these broader indices there has been significantly positive performance of higher rated, higher quality credits and significantly negative performance of lower rated bonds (Figure 7). Equivalent price action has also been exhibited in both the European HY market and in EM credit markets, as well as US HY.
Selloffs in the lowest rated tier of credits have typically been a feature of wider credit market weakness. What we are seeing today is that investors are not only continuing to buy the higher-rated bonds, but that they are also continuing to do so at higher prices, resulting in spreads tightening in the broad indices. Indeed, investors are currently differentiating between the higher- and lower-rated bonds in a way that they haven’t in recent memory.
Ultimately, we believe that distressed debt funds may be feeling the pinch the most as these funds typically invest in the lower-rated bonds and short higher-quality credits through index products.
Problems loading this infographic? - Please click here
As of 29 November 2019.
Indexed to 100 as of 31 December 2018.
With contribution from: Ed Cole (Man GLG, Managing Director), Patrick Kenney (Man GLG, Portfolio Manager) and Santiago Pardo (Man GLG, Portfolio Manager).
1. https://www.theguardian.com/politics/2018/jan/29/youthquake-why-age-did-matter-for-corbyn-in-2017
You are now exiting our website
Please be aware that you are now exiting the Man Institute | Man Group website. Links to our social media pages are provided only as a reference and courtesy to our users. Man Institute | Man Group has no control over such pages, does not recommend or endorse any opinions or non-Man Institute | Man Group related information or content of such sites and makes no warranties as to their content. Man Institute | Man Group assumes no liability for non Man Institute | Man Group related information contained in social media pages. Please note that the social media sites may have different terms of use, privacy and/or security policy from Man Institute | Man Group.