Examining the anatomy of a recession; as volatility starts to spill over.
Examining the anatomy of a recession; as volatility starts to spill over.
August 20 2019
Anatomy of a Recession
How does a typical US recession unfold? We think the sequence looks something like this:
- First, there is a sustained uptick in inflation as corporate input prices rise;
- This leads to a sustained decline in profitability, as firms are unable to pass on price increases to consumers with the same speed at which they are receiving them from raw input suppliers;
- This causes the Fed to start fretting and to try to head off rising inflation with rate hikes;
- With monetary policy pushing up the short end of the curve whilst the long end is anchored by fears around long term economic growth, we see an inversion of the yield curve;
- This means that banks, whose business model is generally to borrow short and lend long, become unprofitable and stop lending. This is particularly bad for the high yield space where companies are highly levered and tend to roll their debt over short periods: with funding markets drying up they are forced to pay more and more for their finance, and HY spreads consequently blow out;
- But this can’t go on for very long, and as liquidity dries up these companies start going bust and laying off workers. Initial jobless claims spike and recession descends.
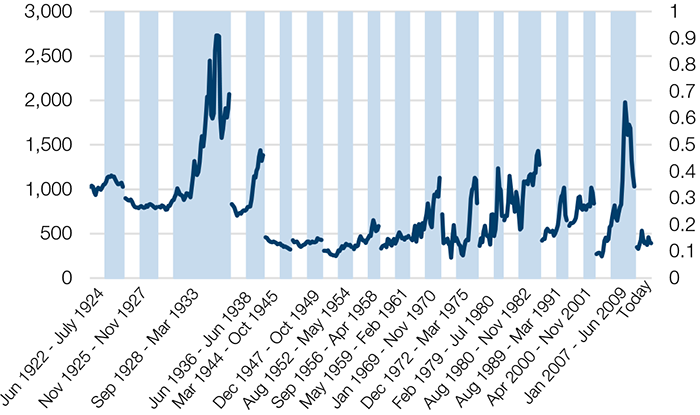
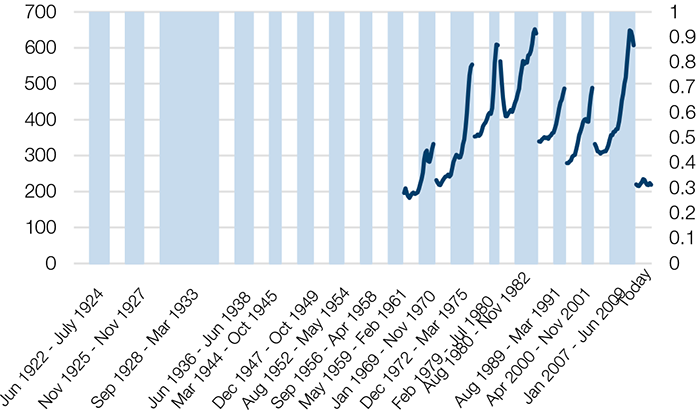
This is borne out in the data. Below we show each of these metrics for every NBER recession going back to 1922 (shaded blue), with the preceding 12 months before each in white. The results are summarised in the table. Of course our framework doesn’t work like clockwork every time because real life is messier than that. But there is clear pattern. And what is equally clear is that today is not conforming to recession warning type. We’re aware that the 10-2 has briefly inverted (although not over a month end so we do not include in our table) but every other measure doesn’t look like a typical inflationary recession (see the final white segment of the charts).
The twist is that where we are now may be a-typical. Negative rates have never been seen before, which could presage a deflationary end-of-cycle. The anatomy of a conventional inflationary recession is clear. But we may be looking at a different animal.
Figure 1. Recession Predictive Data
| Recession | Inflation rising in previous 12 months? | Profitability falling in previous 12 months? | Fed hiking in previous 12 months? | 10-2 inverting in previous 12 months? | HY spread blowing out into the recession? | Claims spiking into the recession? |
|---|---|---|---|---|---|---|
| Jun 1923 - Jul 1924 | Yes | -- | Yes | Yes | Yes | -- |
| Nov 1926 - Nov 1927 | No | -- | No | Yes | No | -- |
| Sep 1929 - Mar 1933 | Yes | -- | Yes | Yes | Yes | -- |
| Jun 1937 - Jun 1938 | Yes | No | No | No | Yes | -- |
| Mar 1945 - Oct 1945 | No | Yes | No | No | No | -- |
| Dec 1948 - Oct 1949 | No | No | Yes | No | Yes | -- |
| Aug 1953 - May 1954 | No | No | Yes | No | Yes | -- |
| Sep 1957 - Apr 1958 | No | Yes | Yes | No | Yes | -- |
| May 1960 - Feb 1961 | No | Yes | No | No | Yes | -- |
| Jan 1970 - Nov 1970 | Yes | Yes | No | Yes | Yes | Yes |
| Dec 1973 - Mar 1975 | Yes | Yes | Yes | Yes | No | Yes |
| Feb 1980 - Jul 1980 | Yes | Yes | Yes | Yes | Yes | Yes |
| Aug 1981 - Nov 1982 | Yes | Yes | Yes | Yes | No | Yes |
| Aug 1990 - Mar 1991 | Yes | No | No | Yes | Yes | Yes |
| Apr 2001 - Nov 2001 | No | Yes | No | Yes | Yes | Yes |
| Jan 2008 - Jun 2009 | Yes | Yes | No | Yes | Yes | Yes |
| Today | No | No | No | No | No | No |
Source: Man Group; as of 15 August 2019.
Figure 2. CPI During Recessions and Preceding 12 Months (1922-2019)
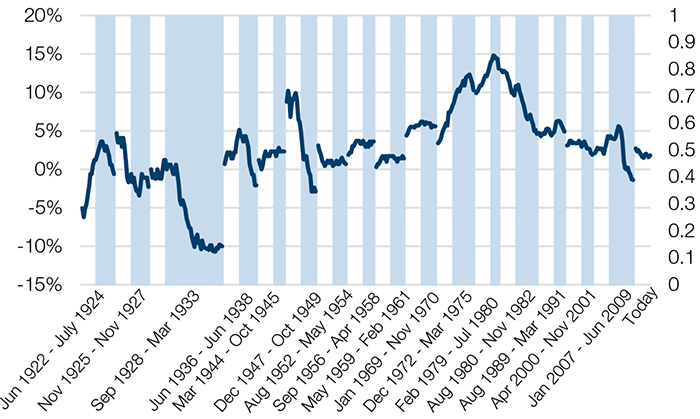
Source: Man Group, Bloomberg; as of 15 August 2019.
Figure 3. Corporate Profits/Gross Value Added, During Recessions and Preceding 12 Months (1922-2019)
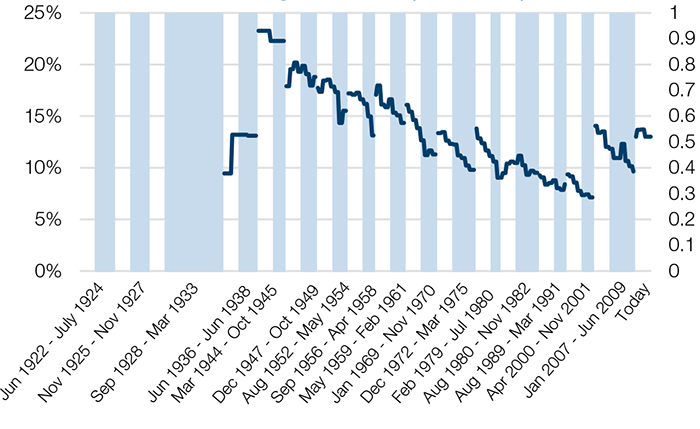
Source: Man Group, Bloomberg; 15 August 2019. Insufficient data available for the period 1922-1930.
Figure 4. Fed Funds Rate, During Recessions and Preceding 12 Months (1922-2019)
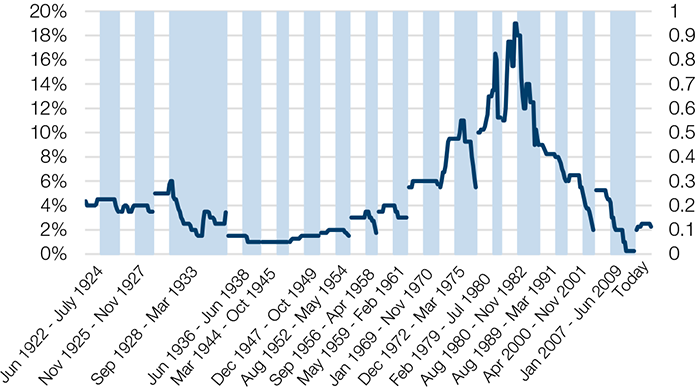
Source: Man Group, Bloomberg; as of 15 August 2019.
Figure 5. 10-2 Yield Curve, During Recessions and Preceding 12 Months (1922-2019)
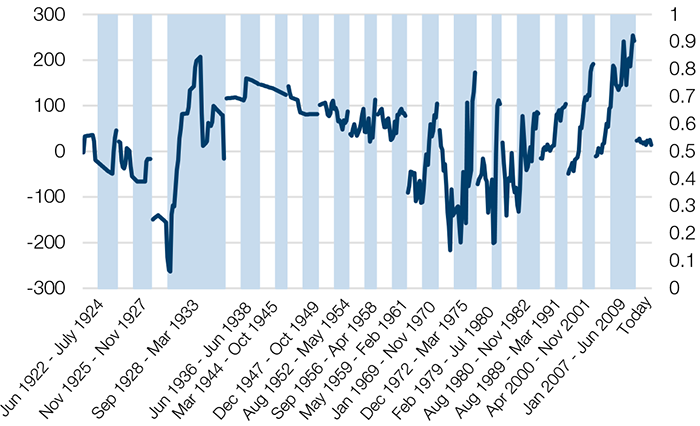
Source: Man Group, Bloomberg; as of 15 August 2019.
Figure 6. High Yield Spreads, During Recessions and Preceding 12 Months (1922-2019)
Source: Man Group, Bloomberg; as of 15 August 2019.
Figure 7. US Weekly Jobless Claims (3-Month Moving Average), During Recessions and Preceding 12 Months (1922-2019)
Source: Man Group, Bloomberg; as of 15 August 2019. Insufficient data available for the period 1922-1967.
Volatility Spills Over
While investors are accustomed to idiosyncratic risks in single name equities, recent geopolitical events that have caused dislocations in local or regional markets are increasingly spilling over globally and across asset classes.
While much of the talk is about the US/China trade war, markets have been further stressed by Argentine elections leading to a 28% decline in the Merval index, Hong Kong demonstrations leaving the Hang Seng down 8.9% during August, crude oscillating between fears of recession and Iranian activity in the straits of Hormuz, Brexit’s continuing effect on sterling, and Italian election fears causing sovereign spreads to widen.1 Events such as Argentina can spill over quickly into other emerging market assets as investors cut risk.
The aggregate effect has been a rush to buy bonds, an increase in implied volatilities across asset classes and weakness in global equities with concerns that the “next” event could be the proverbial straw that breaks the camel’s back. As investors grapple with the odds of recession and more accommodative central bank policies, they may also need to consider the impact of increased volatility and these cross asset dislocations on overall portfolio construction. In our view, this may all suggest the need to reduce gross exposures if cross asset volatility spillovers persist.
Problems loading this infographic? - Please click here
As of 15 August 2019.
With contribution from: Henry Neville (Man Solutions, Analyst) and Peter van Dooijeweert (Head of Institutional Hedging, Man Solutions).
1. As of 15 August 2019.
You are now exiting our website
Please be aware that you are now exiting the Man Institute | Man Group website. Links to our social media pages are provided only as a reference and courtesy to our users. Man Institute | Man Group has no control over such pages, does not recommend or endorse any opinions or non-Man Institute | Man Group related information or content of such sites and makes no warranties as to their content. Man Institute | Man Group assumes no liability for non Man Institute | Man Group related information contained in social media pages. Please note that the social media sites may have different terms of use, privacy and/or security policy from Man Institute | Man Group.