What next after the yuan’s slide?; and the indicator saying buy the dip…unless we are heading for recession.
What next after the yuan’s slide?; and the indicator saying buy the dip…unless we are heading for recession.
August 13 2019
The Yuan Slide – What Next?
China let the yuan drop below 7 per US dollar on 5 August, in response to the latest round of tariff hikes announced by US President Donald Trump. The Chinese government was also likely upset by developments in Hong Kong (perceived as supported by the US), the blacklisting of Huawei and by the US pullback from the 1987 Intermediate-Range Nuclear Forces treaty (which would allow the US to install these missiles in the region to counter China, possibly even threatening to do it in Taiwan).
The escalation of tensions is likely in our view, given the US determination to confront China’s hegemonic intentions sooner rather than later, and given the general political support for the cause in the US.
The list of options for retaliation include: a trade tariff on US products; boycotting the import of US goods; applying geopolitical pressure to counter US policy towards states such as North Korea and Venezuela, the arms race, as well as allowing the yuan to depreciate.
We see the latter as carrying an important advantage for China, which aims to demonstrate to the US their ability to control the depreciation of the currency. Seven yuan per dollar is a key psychological support level, which China has previously been unwilling to breach. This most recent devaluation demonstrates the extent to which the currency can be used as a tool to support the economy in the event of further escalations.
We see the new environment as demanding lower rates – more so than credit easing – given the build- up of credit vulnerabilities. Indeed, we would expect China to continue to rein in credit growth, while easing via a mix of lower rates and orderly depreciation of the yuan. We expect the daily fixing levels of USD/CNY to be the most relevant signal by the People’s Bank of China (‘PBOC’) to the market about the government’s comfort with the speed of depreciation (via the counter cyclical factor, or moves in fixing not explained by the key basket of trading partners).
Our view is that China will probably let the yuan drop to 7.10, then step in to slow down the depreciation more aggressively to land it in the region of 7.15-7.20 as a first stop. However, we admit that market positioning and outflows will determine the exact levels of intervention: the larger the outflows, the less the yuan should be expected to move, as the PBOC responds to stem capital flight.
Problems loading this infographic? - Please click here
As of 8 August 2019.
Buy the Dip ... Unless It’s A Recession
Could now be the time to re-trench and buy equities?
The Morgan Stanley Combined Market Timing Indicator has dipped to a score of -0.68 standard deviations (Figure 2). If the indicator goes above +0.5 or below -0.5 it indicates that managers should, respectively, sell or buy equities. Created by Man Group portfolio managers in their former roles at Morgan Stanley, the indicator factors in equity valuations (largely valuation multiples), fundamentals (earnings revisions, margins and the cost of borrowing), and risk (investor sentiment and liquidity metrics).
Figure 2. Combined Market Timing Indicator
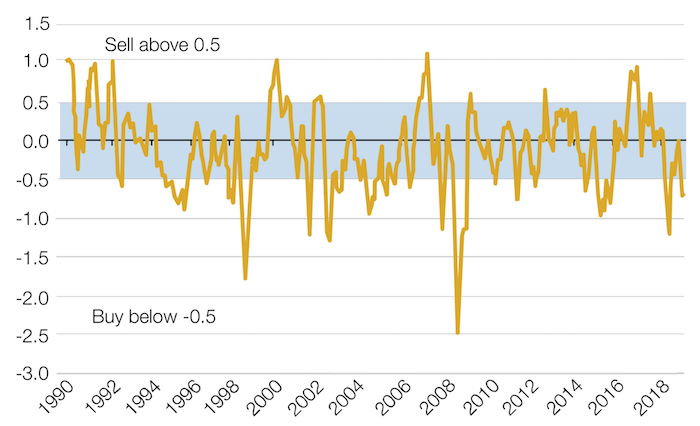
Source: MSCI, Morgan Stanley; as of 2 August 2019.
The recent decline to -0.68 has been driven by a fall in bond yields, a fall in earnings revisions and equity outflows. The model interprets falling bond yields as being positive for growth and the other indicators as contrarian buy signals.
The indicator would suggest a +6.7% performance over the coming six months, and the backtest has a 76% hit ratio from current levels (Figure 3). We view these as decent odds for rising markets, but clearly by the same token there is a 24% chance of down markets, based purely on these backtest statistics. The false positives in the backtest come at the end of cycles, preceding recessions and some major additional sell-offs. With macro-economic data deteriorating, and the potential for a further deterioration in political risk around the world, we can’t fully exclude the possibility of a similar end-of- cycle scenario.
Figure 3. Backtest Data
| 6M Subsequent Performance (%) When Above / Below... | |||||||||||
|---|---|---|---|---|---|---|---|---|---|---|---|
| Latest Value | <-2.0 | <-1.5 | <-1.0 | <-0.5 | <0.0 | >0.0 | >+0.5 | >+1.0 | >+1.5 | >+2.0 | |
| Combined Market Timing Indicator | -0.68 | 7.2 | 8.3 | 6.3 | 6.7 | 5.0 | 0.1 | -4.6 | -9.2 | - | - |
| Composite Valuation Indicator | -0.65 | 6.5 | 5.8 | 6.6 | 6.7 | 6.4 | 1.3 | -1.4 | -2.6 | -0.1 | 2.9 |
| Fundamentals Indicator | -1.10 | 9.8 | 10.6 | 5.9 | 4.8 | 3.8 | 2.2 | -1.9 | -4.4 | 9.1 | 23.9 |
| Risk Indicator | -0.28 | - | 4.1 | 3.9 | 5.1 | 4.5 | 1.4 | -1.0 | -2.7 | - | - |
| 6M Hit Ratio (%) When Each Indicator Is Above / Below... | |||||||||||
|---|---|---|---|---|---|---|---|---|---|---|---|
| Latest Value | <-2.0 | <-1.5 | <-1.0 | <-0.5 | <0.0 | >0.0 | >+0.5 | >+1.0 | >+1.5 | >+2.0 | |
| Combined Market Timing Indicator | -0.68 | 90.0 | 74.0 | 62.5 | 76.3 | 70.8 | 52.9 | 36.3 | 14.6 | - | - |
| Composite Valuation Indicator | -0.65 | 67.6 | 72.6 | 75.7 | 80.9 | 80.1 | 55.6 | 48.9 | 42.5 | 53.1 | 89.1 |
| Fundamentals Indicator | -1.10 | 50.0 | 80.0 | 76.9 | 69.3 | 65.7 | 66.9 | 47.6 | 37.5 | 75.0 | 100.0 |
| Risk Indicator | -0.28 | - | 50.0 | 56.7 | 69.4 | 71.1 | 59.7 | 52.8 | 54.5 | - | - |
Source: MSCI, Morgan Stanley; as of 2 August 2019.
With contribution from: Guillermo Osses (Man GLG, Portfolio Manager) and Teun Draaisma (Man Solutions, Portfolio Manager).
You are now exiting our website
Please be aware that you are now exiting the Man Institute | Man Group website. Links to our social media pages are provided only as a reference and courtesy to our users. Man Institute | Man Group has no control over such pages, does not recommend or endorse any opinions or non-Man Institute | Man Group related information or content of such sites and makes no warranties as to their content. Man Institute | Man Group assumes no liability for non Man Institute | Man Group related information contained in social media pages. Please note that the social media sites may have different terms of use, privacy and/or security policy from Man Institute | Man Group.