Will negative yields in Switzerland create M&A heaven; and has Value reached the end of its ebb tide?
Will negative yields in Switzerland create M&A heaven; and has Value reached the end of its ebb tide?
August 6 2019
Negative Yields, M&A Heaven?
The low interest-rate era since 2008 has been taking on some increasingly odd characteristics; one of them being that Switzerland’s entire government bond market now trades with negative yields (Figure 1). Switzerland is following in Denmark’s footsteps, which earlier in July, became the first country to see its entire yield curve turn negative.
It would make sense for these exceptionally low financing costs to be exploited by corporates: if borrowing costs are next to nothing, this lowers the bar for deals to be EPS accretive.
Indeed, the first half of 2019 has seen a record – in terms of both volumes and deal counts – for mega M&A deals (deals greater than USD10 billion in size). There have been 28 deals worth USD878.9 billion in the first half of 2019, a year-on-year increase of 26.7%.1
Problems loading this infographic? - Please click here
As of 1 August 2019.
Value’s Ebb Tide
Value may (finally) be set for a rebound, as the value spread continues to widen. The current Russell 2000 index trailing 12-month inter-quintile price-to- earnings (‘PE’) spread stands at 85 (Figure 2). This compares with the 25-year average of 45.6. Indeed, the current reading is in 87th percentile since the data set began in 1978.
Historically, when spreads are in the widest quintiles, value stocks have performed well over the coming quarters (Figure 3). Are we about to see value’s ebb tide start to come back in?
Problems loading this infographic? - Please click here
Source: FactSet, FTSE Russell, Jefferies; As of 30 June 2019.
Figure 3. Performance of Value Quintiles, Russell 2000 (Relative Performance)
| Subsequent Relative Performance | |||
|---|---|---|---|
| Valuation Quintile Based on Historical Percentile Rank | 3 Months | 6 Months | 12 Months |
| 1 (Cheapest) | 3.7 | 7.0 | 15.3 |
| 2 | 1.8 | 3.0 | 6.6 |
| 3 | 0.1 | 0.8 | 0.0 |
| 4 | -1.0 | -1.0 | -1.0 |
| 5 (Most Expensive) | -0.8 | -1.7 | -3.7 |
Source: FactSet, FTSE Russell, Jefferies; As of 30 June 2019.
Note: Quarterly data prior to 1987. Relative valuation model consists of relative Trailing and Forward P/E, Price to Book, Price to Sales, and from 2002 Price to Cash Flow; from 31 March 2016 forward Jefferies's estimates.
Korea and the Trade Wars
On 1 August, US President Donald Trump slapped 10% tariffs on the remaining $300 billion of Chinese imports that aren’t already subject to his existing levies.
Aside from the obvious impact the trade war will have on the US and Chinese economies, we are keeping an eye on the impact it will have on South Korea. China and the US accounted for 24.8% and 11.9%, respectively, of South Korea’s total exports in 2018, according to the Korea International Trade Association (‘KITA’).2
The US-China trade war, as well as South Korea’s own trade dispute with Japan, has already resulted in declines in the Kospi and the Korean won (Figure 4).
Figure 4. Declines in Kospi, Korean Won
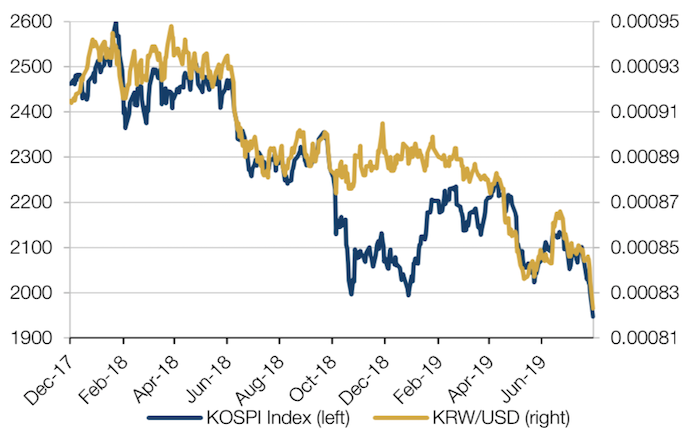
As of 5 August 2019.
With contribution from: Ed Cole (Man GLG, Managing Director), Rob Furdak (Man Numeric, co-CIO) and Matthew Sargaison (Man AHL, co-CEO).
You are now exiting our website
Please be aware that you are now exiting the Man Institute | Man Group website. Links to our social media pages are provided only as a reference and courtesy to our users. Man Institute | Man Group has no control over such pages, does not recommend or endorse any opinions or non-Man Institute | Man Group related information or content of such sites and makes no warranties as to their content. Man Institute | Man Group assumes no liability for non Man Institute | Man Group related information contained in social media pages. Please note that the social media sites may have different terms of use, privacy and/or security policy from Man Institute | Man Group.