In this week's edition: why we believe it only goes up from here for China’s economy; and a look at the value environment from a historical perspective.
In this week's edition: why we believe it only goes up from here for China’s economy; and a look at the value environment from a historical perspective.
April 23 2019

China’s Economy: Low Point?
China reported a 6.4% expansion in the first quarter, its most sluggish in a decade. However, we believe the decade’s low point may also mark the lowest this year for two reasons: China’s new bank loans and the country’s total financial system funding use as a percent of GDP.
China’s new bank loans rebounded in March, rising more than we expected. Chinese banks extended 1.69 trillion yuan in net new loans, compared with analysts’ expectations of 1.25 trillion yuan. The data suggest that the sustained improvement in credit impulse continues to point to a recovery in China (Figure 1), a point we have been flagging since January.
Additionally, total financial system funding use was 60% of GDP in the first quarter. This is a big number and has caused a bit of excitement amongst the commentariat. However, as Figure 2 shows, there have been bigger credit stimulus numbers in the past. As such, we believe that China still has firepower to fend off the ‘sluggish’ growth in the event that it’s needed.
Figure 1: Financial Funds’ Impulse Is Improving
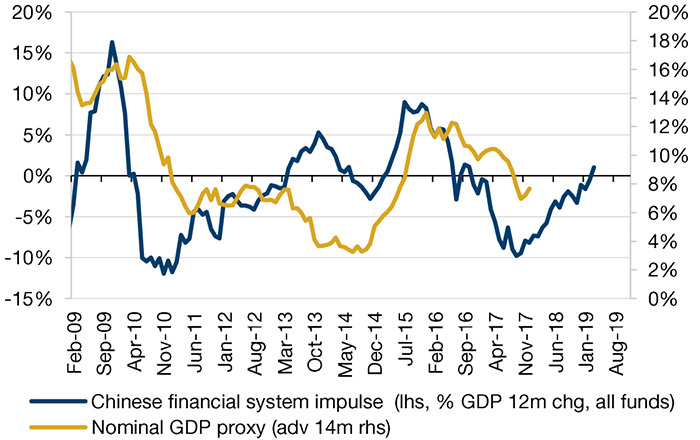
Source: Man GLG; As of March 2019.
Figure 2: Overall Credit Stimulus Isn’t That Big Versus Previous Years
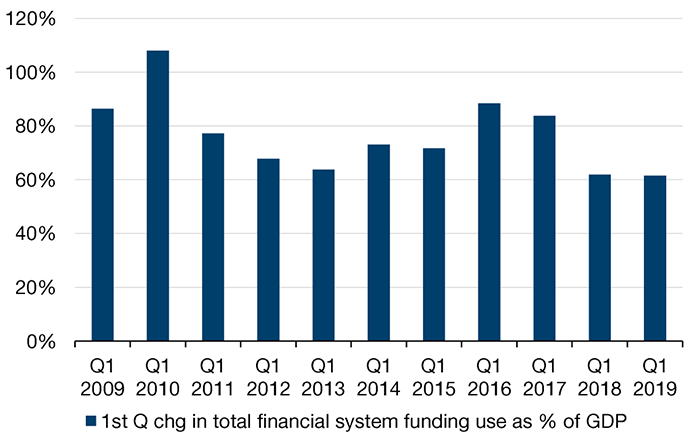
Source: Man GLG; As of March 2019.
Healthcare: A Turn Away from Growth Stocks?
Healthcare stocks across all sub-sectors dropped last week. The XLV Index, the healthcare section of the S&P 500, fell 5% between April 15-18. A particularly dramatic move was in medical technology sub-sector, which had a seven standard deviation fall compared to the rest of the index, based on five-year return data. Morgan Stanley categorised this as an extreme sell-off not previously witnessed over the time period.
However, we see this is less a healthcare-specific story than a possible growth versus value unwind. Our own factor analysis has highlighted the relative outperformance of value and underperformance of growth across both the MSCI All-Country World Index and the Stoxx Europe 600 during the prior week (April 8-12). However, the best performing factor for the S&P 500 during that week had been growth, potentially indicating that the US is lagging the rest of the world. In our view, this healthcare sell-off may herald a regime shift, away from growth stocks and back towards value. This would be consistent with the view expounded previously by some of the firm’s strategists and PMs that global economic momentum is troughing and is likely to reaccelerate, an environment in which value typically outperforms.
The Current Value Environment From a Historical Perspective
Value stocks have historically outperformed growth stocks, despite inferior earnings and book growth. This outperformance stems from multiple expansion and higher yields (Figure 3).
While cheap (or value) stocks have historically had lower forecast earnings growth, recent movements in multiples appear to be countering the long-term trend (Figures 4 and 5), as cheap stocks are experiencing less negative earnings growth and lower multiple expansion, while expensive stocks experience lower forecast earnings growth and less multiple contraction. Indeed, all global stocks are currently experiencing more negative earnings estimates revisions than positive revisions from the sell-side (diffusion index below the zero line in Figure 6 below). However, expensive stocks (or growth stocks, as shown by the green line) are receiving the most net negative revisions, i.e. sell-side analysts are becoming more pessimistic about the expensive stocks than those that have cheap valuations.
Figure 3: Value Stocks Have Historically Outperformed Growth Stocks
|
Annual Return |
Book Growth |
Δ Multiple |
Dividend Yield |
||
|---|---|---|---|---|---|
| Small Cap | Growth | 10.1% | 29.3% | -20.7% | 1.5% |
| Neutral | 14.9% | 5.1% | 7.5% | 2.2% | |
| Value | 17.3% | -6.8% | 21.9% | 2.2% | |
| Mid Cap | Growth | 10.7% | 29.6% | -20.7% | 1.8% |
| Neutral | 13.6% | 8.6% | 2.3% | 2.7% | |
| Value | 15.3% | -2.7% | 15.0% | 3.0% | |
| Large Cap | Growth | 10.7% | 19.7% | -11.2% | 2.2% |
| Neutral | 10.9% | 9.7% | -1.9% | 3.1% | |
| Value | 12.0% | 1.8% | 6.5% | 3.7% |
Source: Center for Research in Security Prices (CRSP3), Compustat; Time period: January 1964 – December 2018. Capitalization tier breakdown of value versus growth is based on book/price tertiles for US stocks.
Figure 4: Cheap Stocks Have Historically Had Lower Forecast Earnings Growth
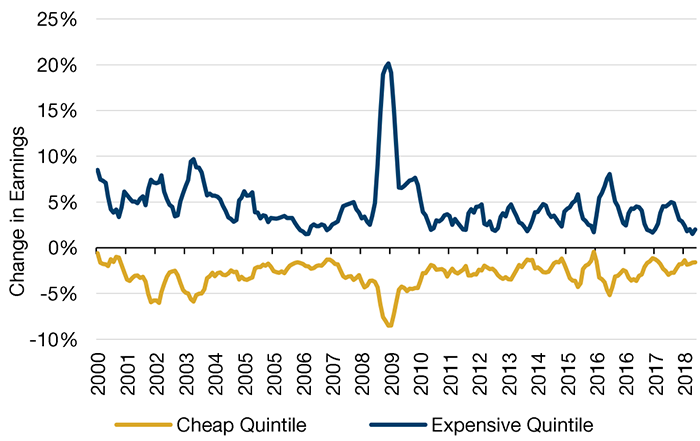
Source: Man Numeric; Time period: January 2000 and March 2019. 6-Month rolling average of industry-adjusted forecast earnings growth and industry-adjusted P/E change, global universe.
Figure 5: Recent Movements Are Countering the Long-Term Trend
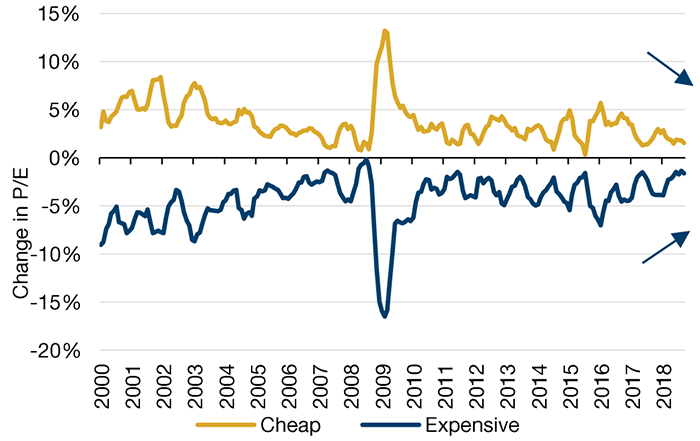
Source: Man Numeric; Time period: January 2000 and March 2019. 6-Month rolling average of industry-adjusted forecast earnings growth and industry-adjusted P/E change, global universe.
Figure 6: Earnings Expectations Are Falling…
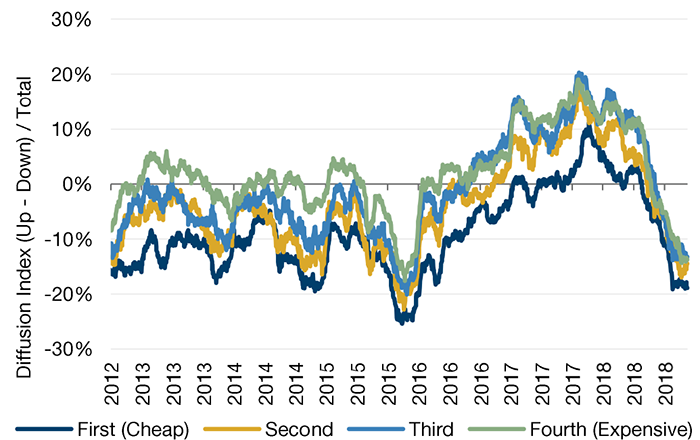
Source: Man Numeric, Thomson Reuters, Global Core Universe. Note: Diffusion Index based on estimate changes for FY1 and FY2 combined. Time period: December 2012 – December 2018.
Figure 7: …Faster for Expensive Stocks
|
First (Cheap) |
Second |
Third |
Fourth (Expensive) |
|
|---|---|---|---|---|
| Period Average$ | -9% | -4% | -1% | 2% |
| Current Level | -19% | -14% | -13% | -14% |
| 3 Mo Change | -8% | -8% | -7% | -9% |
Source: Man Numeric, Thomson Reuters, Global Core Universe. Time period: December 2012 – December 2018.
With contribution from: Edward Cole (Man GLG, Managing Director) Jason Moore (Man Numeric, Head of Client Portfolio Management) and Rob Furdak (Man Numeric, co-CIO).
You are now exiting our website
Please be aware that you are now exiting the Man Institute | Man Group website. Links to our social media pages are provided only as a reference and courtesy to our users. Man Institute | Man Group has no control over such pages, does not recommend or endorse any opinions or non-Man Institute | Man Group related information or content of such sites and makes no warranties as to their content. Man Institute | Man Group assumes no liability for non Man Institute | Man Group related information contained in social media pages. Please note that the social media sites may have different terms of use, privacy and/or security policy from Man Institute | Man Group.